This post is part of a series on my brother’s upcoming book Addiction Nation: What the Opioid Crisis Reveals about Us, discussing some of the science and stats he used throughout the books. Read the intro post here, or find the book here.
Okay! So last week Tim couldn’t introduce himself because he was busy getting married, so let’s kick off with a few words of introduction from Tim. Say hi to the nice people Tim!
Tim: Greetings Graph Paper Diary readers! If any of you have ever wondered if correcting other’s use of data and scientific research is something BS King only does on her blog, I can tell you it is a passion she pursues in all areas of her life. Luckily, I figured out how to take my older sister’s insistence on always being right into a way of getting her to do my homework for me.
That assistance made a huge difference. Addiction is an area that is rife with a poor understanding of science or a complete disregard for it. This can be especially true when looking at the mixture of faith/spirituality and addiction recovery. Since parts of the book draw on my own religious experiences, I wanted to be especially careful not to make some big category errors.
You say “getting her to do my homework” I say “pointing out your faults by request”.
Sibling rivalry aside, I wanted to start off this week by talking about how big the opioid crisis actually is and why we’re all suddenly hearing about it. The blurb for your book actually starts with the stat “Opioids claim the lives of 115 people per day. One of them could have been me.” so let’s start there.
What amazes me about this stat is that it actually is already outdated…the current numbers from the CDC say it’s 130/day. That’s a big jump in just a year or two.
Tim: Ya. The first time I published on the topic was 2016 and the number I was using then was 78 a day. Overall drug overdoses were at 110 a day when I was working on that article.
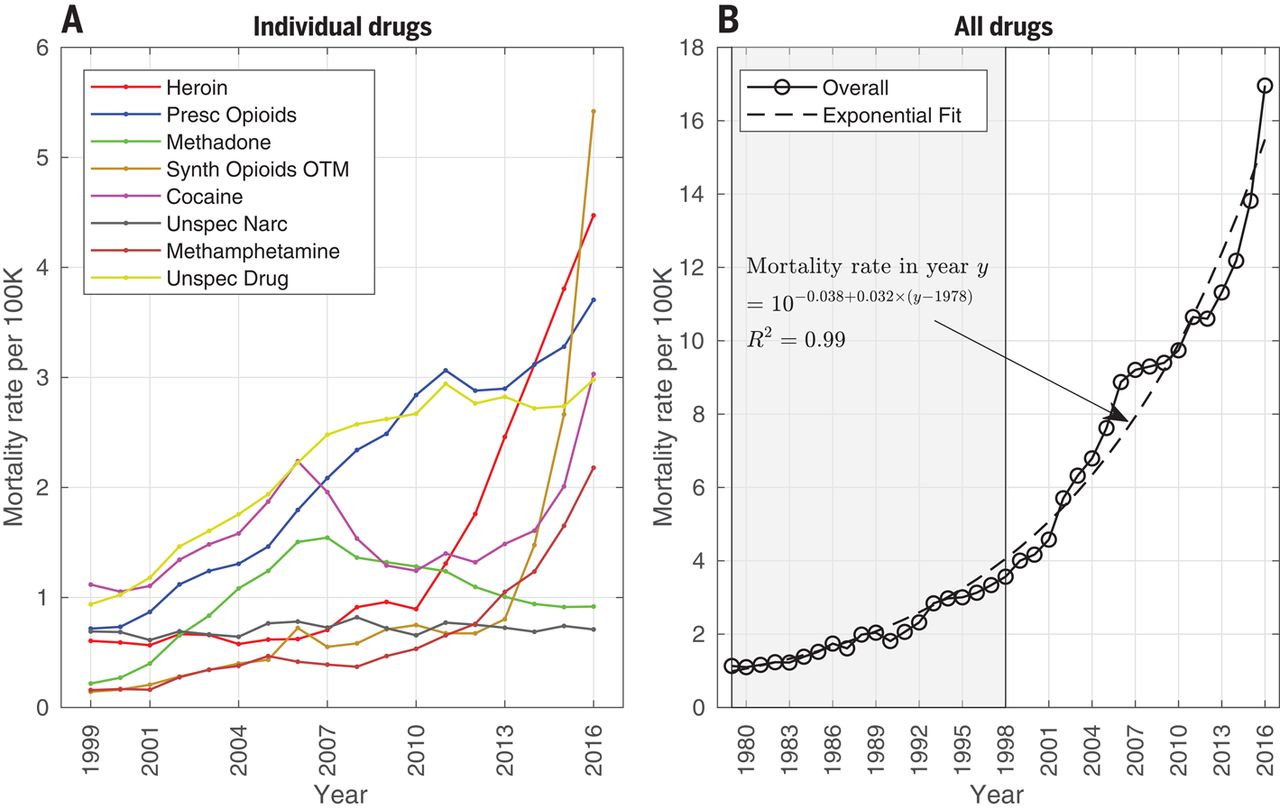
There’s a paper you start off with that has some really interesting graphics about the crisis, “Changing dynamics of the drug overdose epidemic in the United States from 1979 through 2016“. You weren’t able to include the graphs in the book, but this image here is quite striking:

So basically for most of our childhood, the rates of overdose deaths were 2-4 deaths per 100,000. Since 2001 though, the death rate has quadrupled. No wonder we’re hearing so much about it.
The next graph is interesting too, as it shows big increases in heroin ODs in the 20-40 age range, but also big increases in prescription opioid overdoses in the 40-60 age range. Heroin overdoses for the 40-60 year old crowd are now more common than they were in the 20-40 year age range even 10 years ago. That’s crazy.
The weirdest part about this paper is that it specifically cites 2010, the year you got sick, as sort of a turning point for prescription opioids. It’s apparently when they started to crack down, but also when deaths started going up. As the authors say:
Since 2010, the mortality curves for all drug types have been increasing, except for methadone and for unspecified drugs and narcotics. Each drug’s mortality curve shows some variability. For example, the mortality rate from prescription opioids decreased slightly in 2012, whereas the mortality rates from heroin and synthetic opioids have been increasing rapidly. These trends may be related because several epidemic interventions may have reduced the impact of prescription opioids around 2010, including the reformulation of OxyContin in 2010 (6), implementation of pain clinic laws and mandatory checking of Prescription Drug Monitoring Program data by prescribers (7), the reduction in the amount of opioids prescribed (8), and the rescheduling of hydrocodone compounds in 2014 (9). Although these changes may have reduced the overdose deaths from prescription opioids, it is possible that they may have led some opioid-dependent persons to switch to illicit opioids, such as heroin and fentanyl.
That’s kind of scary, because it really highlights how a good public health measure can have unintended consequences. Your own doctor’s wisdom in partnering with you to slowly easing you off prescription pain killers keeps looking wiser and wiser.
Tim: Unintended but not necessarily unexpected. Those early reforms only focused on the supply side of the problem. The demand for the drugs was still there so the black market grew. That market then became incredibly profitable, completely unregulated and exponentially more dangerous. Take a highly motivated market of people who are ready to buy and a large pool of people who see a shot for an income they otherwise couldn’t dream of, and you are creating the perfect conditions to intensifying the problem.
Yeah, it’s clear the worst part is those reforms didn’t even do much to stem the tide (Tim: and actively made things worse), as between 2013 synthetic opioid overdoses would go from 1 death per 100k to almost 6 in the next 3 years.
Going back to the heat map above though, I was interested to see how regional some drug problems are. Any thoughts on why that is?
Tim: High population-wide levels of addiction seem to have a whole confluence of factors from economic and political to social and cultural. Sam Quinones does an excellent job tracking some of these factors in his book Dreamland.
- Stress: High-stress environments, especially those that result in childhood trauma, are going to be petri dishes for addictions to grow. There is good reason to believe that living in an environment with intermittent access to resources creates a higher level of ongoing stress than a low resource environment. Poverty is often a driver of this kind of stress, but not necessarily so.
- Cultural: Binge drinking is known to spike among college students, but only those who live on campus. Cultural expectations and levels of usage shift dramatically based on your peers.
- Social: We’ll dive into this one in a future post but there is good reason to believe that social dislocation is a primary driver behind addiction.
- Supply: While I note before that only focusing on supply is a recipe for disaster, supply is still a factor. Drugs needs supply chains and distributors. These can take a while to set up. The higher the demand, the higher the profit and the more risks people will be willing to take to move into new markets.
Interesting! One region that’s been particularly hard hit of course is the state we grew up in, New Hampshire. New Hampshire had the dubious distinction of skyrocketing to the top of the state opioid overdose list. You cited a report by Dartmouth School of Medicine that said that a bag of fentanyl laced heroin was selling for less in New Hampshire than a 6 pack of beer. Wow. New Hampshire is where us Massachusetts folks go to get our cheap beer.
Apparently though, New Hampshire is also where Massachusetts drug dealers send a lot of fentanyl. According to the report, they can charge higher prices in NH. There have been some major busts trying to stop this pipeline, but NH appears to be a bit of a target. Any idea why that is?
Tim: The Dartmouth researchers noted that NH is a standout in being a pretty wealthy state in comparison to many of the others that have been hardest hit. One possible explanation is that NH has small pockets of poverty spread throughout the state and these are the communities that have shifted statewide averages. They also note that NH has one of the lowest per capita spending for recovery services in the country.
But one other theory they posit is, in essence, the “Live Free or Die” mentality. I’m proud of the state motto and love the sense of independence in our home state. But, it can have a dark side. One of the ideas I explore in the book is that addiction began for me not in a loss of control but in my seeking of control.
When I was in the hospital, one of the few things I could control was my ability to push a button for more narcotics. It wasn’t just relief from pain but a sense of comfort and as if I still had agency in my life.
I would not be surprised if some of my fellow Granite-Staters, from a variety of different circumstances, might have started there own addictions out of wanting to maintain a sense of independence and control in their own lives. Then later, the solution they relied on, slowly unraveled.
That theory makes a lot of sense! New Hampshire definitely seems to have something going on. It’s interesting that while you went through most of your addiction journey in and around Washington DC, it was actually moving back to New Hampshire that clued you into the extent of the crisis. DC and New Hampshire overdose rates are shockingly similar given that DC is totally urban and New Hampshire is not. Normally those are two populations we’d avoid comparing due to the dramatic differences, but here they seem to have converged. Not a good sign for NH.
It looks like overall it’s pretty clear the crisis has been growing, though it does appear things may be leveling off slightly. All the sources seem to point to an increase in the number of available prescription and synthetic opioids, but there’s clearly something societal going on as well. I know that’s a lot of what your book is about, but any quick thoughts on just the scope of these numbers before we wrap up?
Tim: To put some of these numbers in perspective. More Americans will die from a drug overdose this year than those who died in the Vietnam and Korean Wars combined. More Americans will die from the opioid crisis than all of World War II.
When we open up the lens a little more and realize that the opioid crisis is just one part of a broader failure of how we understand and treat addiction, the numbers continue to climb. Millions of more lives are lost in a criminal justice system that can exacerbate addiciton, not cure it.
Man, that’s a depressing thought. Hopefully in the next few posts we’ll get more in to some things that do and don’t work.
PS: Great text from my brother after we finished this. Someone’s a little nervous about getting his facts straight!


Pingback: Addiction Nation: What Hurts, What Helps | graph paper diaries
Pingback: Addiction Nation: The Data Behind the Book (Intro Post) | graph paper diaries
Pingback: Addiction Nation: Controversial or Disputed Research | graph paper diaries
Pingback: Addiction Nation: Recovery and Hope | graph paper diaries