Happy Wednesday everyone….or is it?
I stumbled across a new-to-me study recently: “Temporal Patterns of Happiness and Information in a Global Social Network: Hedonometrics and Twitter“, and I’ve been fascinated by it ever since. It’s a cumbersome name for an interesting study that analyzed Twitter posts to determine if there’s any pattern to when we express certain types of feelings on social media. For example, use of the word “starving” rises as you approach typical meal times, and falls once those times pass:
This data is fascinating to me because it gives some indication of where social media reflects reality, and some ideas of where it might not. For example, it appears the word starving is not often used at breakfast, but is used quite a bit for lunch. I don’t know that people are really the hungriest right before lunch, but it appears they may be most likely to want to express feelings of hunger at that time. I am guessing this is because people may have less control over when they get to eat (being at work, running around with errands, etc) and thus may get more agitated about it.
The researchers decided specifically to look at happiness as expressed through social media posts. They tracked this on a day to day basis, and the decided to figure out which days of the week were the happiest ones. Turns out Wednesday’s not looking so good:
I know the running joke is about Monday, but it’s interesting to note that Tuesday fared the worst on this ranking. I suspect that’s related to the fact that Monday’s may instill the most dread in people, but aggravation you want to express may need a day or two to build up. Of course if you look at the overall scale, it’s not clear how much of a difference a score of 6.025 vs 6.08 really makes, but I’ll roll with it for now.
That havg on the y-axis there kind of an interesting number. They pulled out a lot of commonly used Twitter words, then asked people on Mechanical Turk to rate how happy each word made them on a scale of 1 to 9. Here’s how some common words fared:
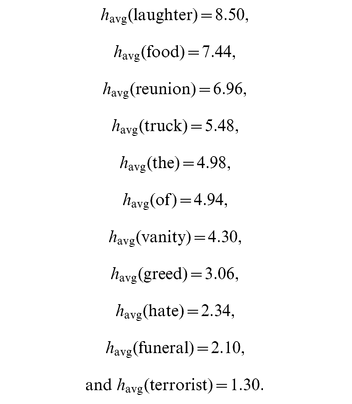
I love that they ranked “the” and “of”, and was interested to see that vanity was more highly rated than greed.
Interestingly, in order to keep their data clean, the researchers also excluded a few days that produced noticeable changes in happiness measures. Some of these were for obvious reasons (like holidays, days of natural disasters), but some were kind of funny. For example, they noted that May 24, 2010 as an unusual date because:
“the finale of the last season of the highly rated television show ‘Lost’, marked by a drop in our time series on May 24, 2010, and in part due to the word ‘lost’ having a low happiness score of havg = 2.76, but also to an overall increase in negative words on that date.”
This of course shows an interesting weakness in social media studies….you always risk counting things that shouldn’t be counted. Additionally, you may give more credit to certain days than they deserve. For example, Saturday got a boost because of the high rankings of the word “party” and “wedding”, both of which are mostly held on Saturdays.
As social media continues to dominate our lives, I’m sure we’ll see progressively more research like this. Always interesting to consider the possible insights vs ways it can be misleading. Good luck with Wednesday folks, Saturday’s right around the corner.

Interesting that there was so little difference in the days at all.
LikeLike
Here is an interesting article on statistics.15 Times Major Media Outlets Used a Statistic about Plastic Straws Based on Research by a 9-Year-Old. No, I haven’t read it yet. Courtesy of Instapundit.
https://pjmedia.com/instapundit/287163/
LikeLike
I saw the headline earlier this week, but I love this follow up. Good to point out how far these stats can get with just a little push.
LikeLike
fascinating! Of course, lots of methodological minefields, but such interesting data…
LikeLike
I think social media research is one of the most fascinating/concerning areas I think we have going on right now! It’s definitely capturing something about human behavior, just not always sure what 🙂
LikeLike
Any specific method is just one lens for actual behaviour, and that includes social media data…There is actually quite a bit of research into wellbeing and associated topics using EMA (ecological momentary assessment), though again plenty of methodological pitfalls! Seems like a combo of social media and EMA methods could be interesting though.
LikeLike
There’s a really interesting piece in Nature this month that actually touches on that sort of thing:
https://www.nature.com/articles/d41586-018-01023-3
The authors propose that researchers should use a few different methodological approaches then compare their results to make sure that the biases with each method were being controlled for. I definitely think seeing a side by side of two methods would be fascinating!
LikeLike