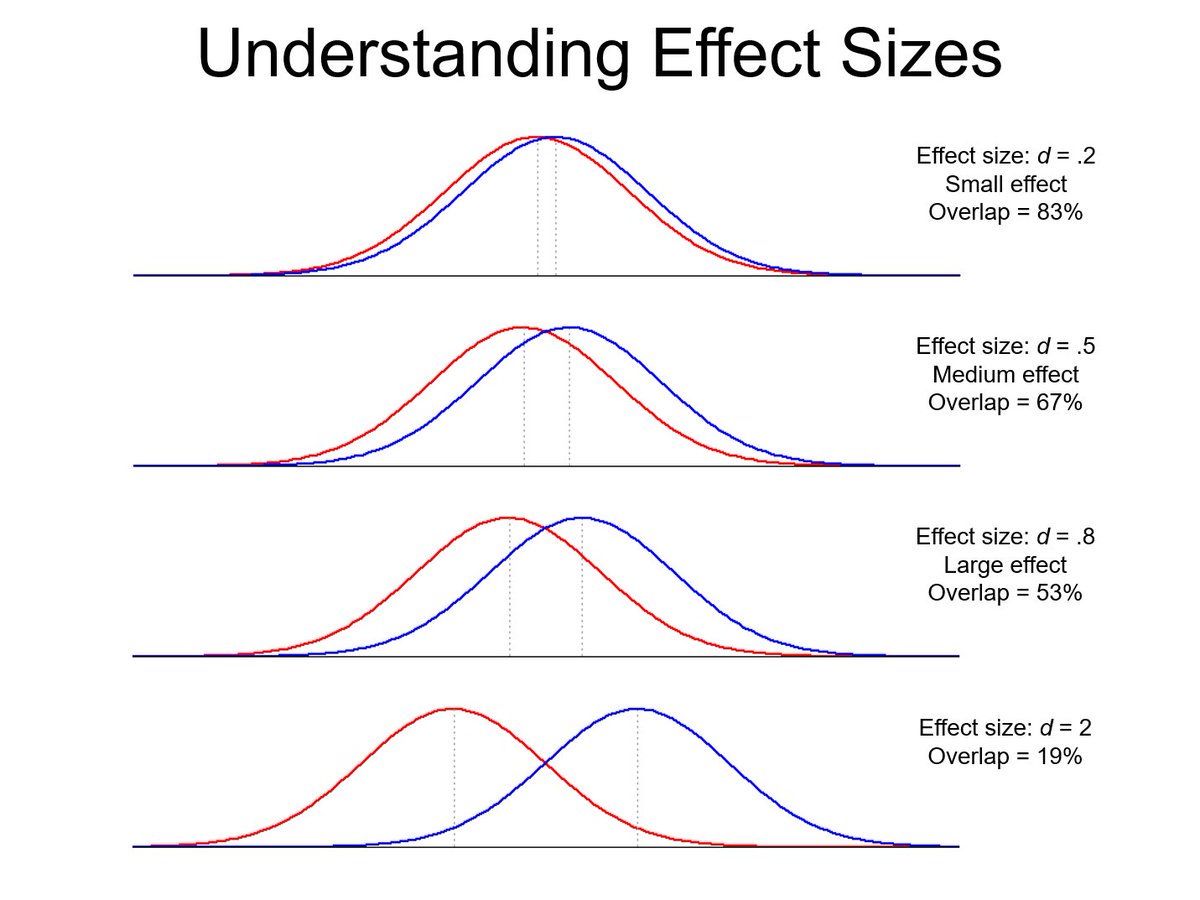
Under the weather this week, but I wanted to post this excellent graph from Twitter, showing what different Cohen’s d effect sizes mean in practice for populations:
I love this because despite the efforts of many many people, every time you see some sort of “group x is different from group y” type assertion, you still see people claiming that this either:
- Can’t be true because they know someone in group y who is more like group x or
- This is completely true and every from group x is superior to every member of group y
Both are mistakes. For a more detailed look, there’s a visualization tool here that shows what these translate in to for random superiority. In other words, if you pick one person from each group randomly, what is the chance that the one from the higher group will actually have an outcome above the other person?
- For d=.2, it’s 55.6%
- For d=.5, it’s 63.8%
- For d=.8, it’s 71.4%
- For d=2, it’s 92.1%
This is good to keep in mind, as Cohen’s d is not an overly intuitive statistic for most people. Visualizations are good to help see quickly what these differences might mean on the population level.
Not the most groundbreaking point, but one that seems to bear repeating!

Thank you for this insightful article. In the tweet you linked to is a reference to “Factfulness” by Hans
Rosling– https://archive.org/stream/FactfulnessByHansRosling/Factfulness%20by%20Hans%20Rosling_djvu.txt
LikeLike
I saw that! Haven’t read it yet, but it’s on my list.
LikeLike
I think in terms of these curves almost automatically for any measure in which groups are supposed to be different. I don’t know how long I have done it at this point.
LikeLike
What an excellent thing to have trained yourself to do! I’ll have to work on this.
LikeLike
No, it’s pretty much my only shortcut. One-trick pony. Fortunately, it’s a good one.
LikeLike