A reader named Doug has sent me a couple of awesome articles about p-values (thanks Doug!) and why we should regard them with suspicion. As often happens with these things, I subsequently tried to explain to someone unfamiliar with stats/math why this is such an interesting topic that everyone should be aware of and realized I needed a whole blog post.
While most people outside of research/stats circles won’t ever understand the math part of a p-value calculation, it’s actually a pretty important concept for anyone who wants to know what researchers are up to. Thus, allow me to go all statsplainer on you to get you up to speed.
Okay, so why are you anthropomorphizing p-values and accusing people of being mad at them?
Well, you probably didn’t click on the link up there that Doug sent me, but it was a post from the journal Nature on the American Statistical Association’s recent warning about the use of p-values in published literature.
P-values and the calculation thereof are a pretty fundamental part of most basic statistics courses, so to see a large group of statisticians push back against their use is a bit of a surprise.
Gotcha. So the people who taught us to use them in the first place are now telling us to watch out for them. Fantastic.
Yeah, they kind of acknowledge that. Their paper on the issue actually starts with this joke:
Q: Why do so many colleges and grad schools teach p=0.05
A: Because that’s still what the scientific community and journal editors use
Q: Why do so many people still use p=0.05
A: Because that’s what they were taught in grad school
That’s a terrible joke. I’m not even sure I get it.
Yeah, statistical humor tends to appeal to a limited audience. What it’s trying to point out though is that we’ve gotten ourselves in to a difficult spot by teaching “what everyone does” and then producing a group of people who only know how to do what they were taught.
Okay, that makes sense I guess…but what does the whole p=0.05 thing even mean?
Well, when you’re doing research, at some point or another you’ll want to do something called “hypothesis testing”. This is the basis of most published studies you hear about. You set up two opposing sides, formally called the null and alternative hypothesis, and then you figure out if you have the evidence to support one or the other.
The null hypothesis H0, is typically the theory that nothing interesting is happening. Two groups are equal, there’s no change in behavior, etc etc.
The alternative hypothesis Ha, is typically the theory you REALLY want to be true…at least in terms of your academic career. This would mean that something interesting is occurring: two groups are different, there’s a change in behavior, etc etc.
Okay, I’m with you so far…keep going.
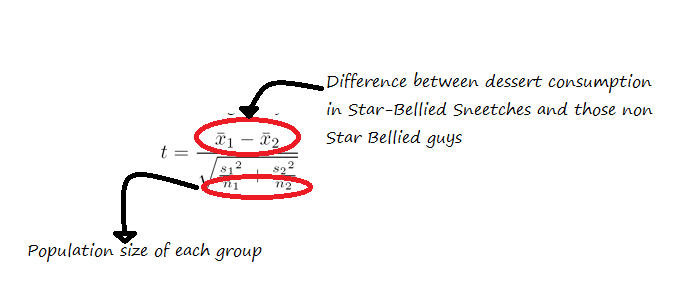
This next step can work differently depending on the experiment/sample size/lots of other details, but lets say we’re comparing Star Bellied Sneetches to those without stars on their bellies and seeing if the groups eat a different amount of dessert. After we calculated the average dessert eaten by both groups, we would calculate something called a t statistic using this equation.
Once we have that value, we take the amusingly old school step of pulling out a table that looks like this, and then finding the value we want to compare our value to.
Okay, so how do we figure out where on this table we’re looking?
Well, the degrees of freedom part is another whole calculation I threw in just to be annoying, but the other part is your α, or alpha. Alpha is what we’re really referencing when we say p=0.05….we set our significance level (or alpha) at .05, so now that’s what we’re aiming for. If the value we calculated using that equation up there is larger than the value the table gives, then it’s considered a finding significant at the level of alpha.
I think I lost you.
That’s fine. Most stats software will actually do this for you, and spit out a nice little p-value to boot. Your only decision is whether or not the value is acceptable. The most commonly used “significant” value is p < .05.
Okay, how’d we pick that number?
Arbitrarily.
No really.
No, that’s really it. This is why that joke up there was funny. After all the fancy technical math, we compare it to a value that’s basically used because everyone uses it. Sometimes people will use .1 or .01 if they’re feeling frisky, but .05 is king. There’s even an XKCD comic about it:

This is where we get in to the meat of the issue. There’s no particularly good reason why .049 can make a career and .051 doesn’t. As I showed with the equation above, the difference between those two values can actually be more about sample size than the difference in effect.
In theory, the p-value should mean “the chances we’d see an effect larger the one we are seeing if the null hypothesis was true”, but the more people aspire to the .05 level, the less accurate that becomes.
Why’s that?
Well, a couple reasons. First, the .05 value will always mean that 1 out of 20 p-values could be due to chance. For some studies that gather a lot of data points, this means they will almost always be able to get a significant finding.
This tactic was used by the journalist who published an intentionally fake “chocolate helps you lose weight” study last year. He did a real study, but collected 18 different measures on people who were eating chocolate, knowing that chances were good that he would get a significant result on one of them. Weight loss ended up being the significant result, so he led with that just downplayed the other ones. Other researchers just throw the non-significant effects in the drawer.
There’s also the issue of definitions. It can be really hard to grasp what a p-value is, and even some stats text books end up saying wrong or misleading definitions. This paper gives a really good overview of some of the myths, but suffice it to say the p-value is not “the chance the null hypothesis is true”.
Okay, so I think I get it. But why did the American Statistical Society speak out now? What got them upset?
Yeah, let’s get back to them. Well as they said in their paper, the problem is not that no one has warned about this previously, it’s that they keep seeing the issue. Their exact words:
Let’s be clear. Nothing in the ASA statement is new. Statisticians and others have been sounding the alarm about these matters for decades, to little avail. We hoped that a statement from the world’s largest professional association of statisticians would open a fresh discussion and draw renewed and vigorous attention to changing the practice of science with regards to the use of statistical inference.
As replication crises have rocked various fields, statisticians have decided to speak out. Fundamentally, p-values are really supposed to be like the SAT: a standardized way of comparing findings across fields. In practice they can have a lot of flaws, and that’s what the ASA guidance wanted to point out. Their paper essentially spelled out their view of the problem and proposed 6 guidelines for p-value use going forward.
And what were those?
- P-values can indicate how incompatible the data are with a specified statistical model.
- P-values do not measure the probability that the studied hypothesis is true, or the probability that the data were produced by random chance alone.
- Scientific conclusions and business or policy decisions should not be based only on whether a p-value passes a specific threshold.
- Proper inference requires full reporting and transparency
- A p-value, or statistical significance, does not measure the size of an effect or the importance of a result.
- By itself, a p-value does not provide a good measure of evidence regarding a model or hypothesis.
They provide more explanation in the paper, but basically what they’re saying is what I was trying to get across above: p-values are useful if you’re being honest about what you’re using them for. They don’t tell you if your experimental set up was good, if your explanation for your data is reasonable, and they don’t guard against selection bias very well at all. The number “.05” is good but arbitrary, and the whole thing is a probability game, not a clear “true/false” line.
Okay, I think I get it….but should statisticians really be picking on other fields like this?
That’s a good point, and I’d like to address it. Psychologists don’t typically walk in to stats conferences and criticize them, so why do statisticians get to criticize everyone else? Andrew Gelman probably explains this best. He was one of the authors on the ASA paper, and he’s a baseball fan. In a post a few months ago, he said this:
Believing a theory is correct because someone reported p less than .05 in a Psychological Science paper is like believing that a player belongs in the Hall of Fame because hit .300 once in Fenway Park.
This is not a perfect analogy. Hitting .300 anywhere is a great accomplishment, whereas “p less than .05” can easily represent nothing more than an impressive talent for self-delusion. But I’m just trying to get at the point that ultimately it is statistical summaries and statistical models that are being used to make strong (and statistical ridiculous) claims about reality, hence statistical criticisms, and external data such as come from replications, are relevant.
As Bill James is quoted as saying, “the alternative to good statistics isn’t no statistics…it’s bad statistics.”
Got a question you’d like an unnecessarily long answer to? Ask it here!
