There’s a lot in the news right now about border crossing, immigration and asylum claims, and I’m seeing all sorts of numbers being thrown around on Twitter. I wanted to do a quick round up of some numbers/sources to help people wade through it.
First up, every month US Customs and Border Patrol publishes the number of apprehensions they have at the Southern US Border and how that compares to the last 5 years. They do this relatively close to real time, we have the numbers for May, but not yet for June. If you want to know why you’re seeing so much in the news, take a look at this graph:
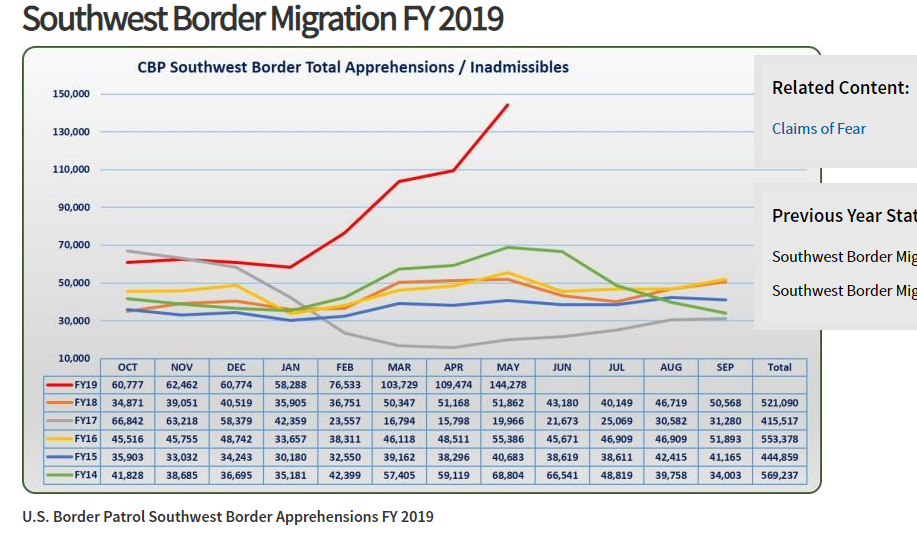
So with 4 months left to go in the fiscal year, we’re already 100,000 over the highest year on that chart. To give some context to that though, apprehension numbers have actually been relatively low for the last few years. They peaked at 1.6 million in the late 90s/early 2000s. However, there have been some changes to the makeup of that group….family crossings. Vox published this chart based on the CBP data that shows how this has changed:
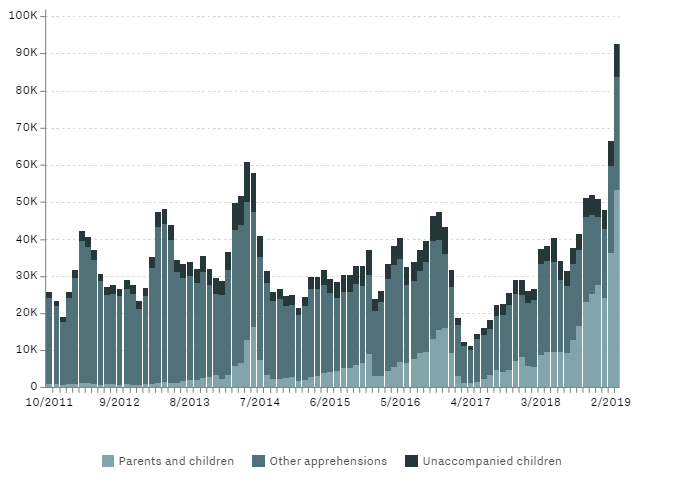
I couldn’t find what those numbers were during the last spike, but it seems to be a record high.
So now what about asylum claims? Recently acting DHS Secretary Kevin McAleenan said the 90% of asylum seekers were skipping their hearings, but others were claiming that actually 89% show up. That’s a MASSIVE discrepancy, so I wanted to see what was going on.
First up, the 89% rate. The DOJ publishes all sorts of statistics about asylum hearings, and in this massive report they showed the “in absentia” rates for asylum decisions (page 33):

So for FY17, asylum claimants were at their decision hearing 89% of the time.
So where did the “90% don’t show up” claim come from? Reading the full context of McAleenan’s quote, it appears that he was specifically referencing a new pilot program for families claiming asylum. From what I can tell the pilot program is not published anywhere, so it’s not possible to check the numbers.
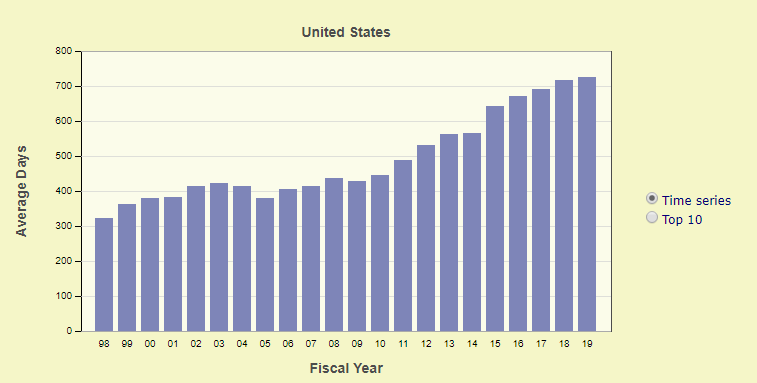
So is it plausible it jumped from 11% to 90%? I tend to doubt it, but it’s important to note the lag time here. The last published DOJ numbers are from FY2017, but those are for hearings that took place in FY2017. The average wait time for hearings in these cases for these cases is enormous….727 days so far in 2019. These wait times are climbing, but if you toggle the graph around, we can see that the wait time back in 2015 was nearly two years:
So essentially those with decisions in FY2017 probably filed in FY2015. And a lot has happened to the stats since then. First, here are the number of applications over the last few years:
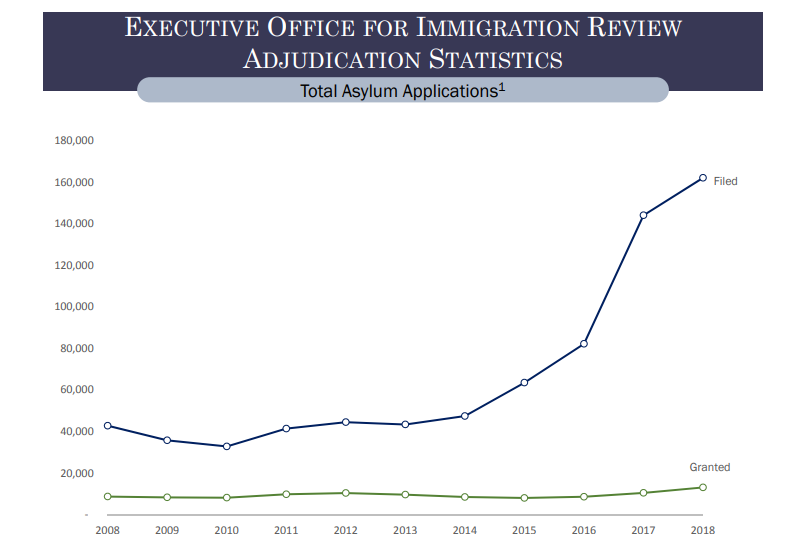
So compared to 2015, the number of applications have tripled but the number of approvals has barely budged. We don’t yet know what that will do to the percentage of people who show up, but it seems very plausible that it could increase the absentee rate. Additionally, because family migration is increasing so rapidly, it’s not clear what that will do to the numbers. Regardless, McAleelan’s reference was specifically to that group, so it was only a subset of the numbers that were previously reported. Still, 90% seems awfully high.
Complicating things further of course is the fact that this was a “pilot program”. That means it could have selected just one country or point of entry. One of the more interesting fact sheets from the DOJ site was the rate of asylum approvals by country. In the past few years, here are the top countries (page 29 of this report):
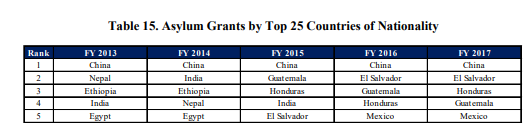
The rates of granting asylum from each of these countries were wildly different in 2018 though. Chinese asylum seekers were 53% granted, El Salvador was 15%, Honduras was 14%, Guatemala was 11%, Mexico was 6%. It seems plausible that a pilot program might have just been addressing those that arrive at the southern border, so it’s possible that individual countries have different profiles.
Overall, it’s clear that the data on this topic is worth watching.

How many of those numbers are guesses? Do we know that bureaucrats report 100% 100% accurately? What do those apprehended lie about? Age? Country of origin? Reason for coming? At best these are slightly helpful at worst a bunch of inaccurate data used to wastemor OPM.
LikeLike
So I would suspect most of these are fairly accurate from the government side, since I would suspect some of these are used for funding. But of course I don’t believe any bureaucrat does anything 100% accurately, so there’s that.
Self report for those apprehended shouldn’t impact anything I quoted here, as claiming asylum is a separate thing from proving the case. The only thing I quoted that might be self report is country of origin, and I’ll admit I’m not sure why someone would lie about where they are coming from. I don’t think any of the numbers I quoted are contingent on age.
I’m actually curious which part you think is exaggerated or off here?
LikeLike
A comment I just posted at my own site may be of interest, bluecat: “I take a slightly different view, that statistics can be made to tell the truth if you grab them by the collar, shove them against the wall, and make them tell you who their friends are. With sports that is often easy to guess – players, owners, fans, and agents all have pretty clear agendas, you simply have to remember to look. For social sciences, those pretend that they are objective and have no true friends, so it gets more difficult. Yet once you have discovered who their friends are – usually the people who pay them and give them status, or more indirectly but just as reliably, who funds and gives status to their tribe – you are on your way.”
LikeLike