It took me a few years of working with data before I realized what my primary job was. You see, back when I was a young and naive little numbers girl, I thought my primary job was to use numbers to expand what we knew about topics. I would put together information, hopefully gain some new insights, and pass the data on thinking my job was done.
It didn’t take me long before I realized the job was barely half finished.
You see, getting new insights from data is good and important, but it’s no more important than what comes next. As soon as you have data that says “x”, the natural inclination of almost everybody is to immediately extrapolate that out to say “Oh great! So we know x, which means we know y and z too!”. It’s then that my real job kicks in. Defending, defining and reiterating the limitations of data is a constant struggle, but if you are going to be honest about what you’re doing it’s essential.
I bring this up because I ran across a disturbing story that illustrates how damaging it can be when we don’t read the fine print about our data. The whole story is here (along with the great subtitle “The Hills Have IPs”), and it’s about one family’s tech-induced ten year nightmare.
The short version: 10 years ago, a company called MaxMind starts a business helping people identify locations for IP addresses associated with particular computers. When they can’t find a location, they set up a default for the geographic center of the USA. Unbeknownst to the company, this gets associated with the street address of a small farmhouse in Kansas. Over the next decade, every person who attempts to track down an IP address that’s not otherwise located (about 600 million of them) is given this address, which causes a constant stream of irate people, law enforcement and others to show up at the door of this farmhouse believing that’s where their hacker/iPhone thief/caller/harasser etc lives. The family has no idea why this is happening, and the local police department literally says the bulk of their job is now keeping angry and confused people away from this family.
The reporter who wrote the article (seriously, go read it) is the first person to put two and two together and actually figure out where the mix up happened.
What’s interesting about this story is that when it was brought to their attention, the company pointed out they actually have ALWAYS told customers not to trust the addresses given. They have always told people that results were only accurate within zip code or town. It’s not surprising that many individuals failed to recognize this, but it IS concerning that so many law enforcement agencies failed to take this in to account. This isn’t just local departments either….the FBI and IRS have investigated the address several times.
Want to know the scariest part? The reporter only figured this out by going through the companies records and then having someone build a computer program to find physical addresses associated with high numbers of IP addresses. While the Kansas farm was the worst, there were hundreds of other addresses with similar problems, including one that was a hub for lost iPhones that started her crusade. Without people grasping the limitations of this data, all of these homes are subject to people showing up angry, believing that someone else lives there.
As technology and the “big data” era expands, knowing what you don’t know is going to become increasingly critical. Small errors made at any one point in the system can and will be magnified over time until there can be real trouble. The fine print maybe never be as interesting as the big reveal, but it could save you a lot of trouble in the long run.
Well hi there! Welcome back to our Pop Science series. After two weeks working on the best science references in music (Part 1 and Part 2) , we moved on to two weeks on the most mediocre science references (Part 1 and Part 2). If you’re losing track, I made a page for the whole thing here. Anyway, we are now moving down the ladder one step further and heading in to the worst science references we could find. Hang on to your hats, there’s muppet fighting pits ahead. Ready? Of course you are!
It’s Hot by Jay-Z Nominated Line: “.38 revolve like the sun round the Earth.”
Bethany: Okay, so let’s start out giving Jay-Z a little bit of credit here. For the vast majority of human history, this line would have appeared correct to most people. After all, from a simple “look up in the sky” perspective, it’s hard to tell if the earth revolves around the sun or if the sun revolves around the earth. Aristotle believed the sun revolved around the earth, and it took centuries before the debate was settled.
Unfortunately for Mr Z here, this debate has been settled for quite some time. The entire idea of heliocentrism made the Catholic church pretty cranky back in the day, but even the Pope gave up on debating this point in 1822. Some of the greatest minds in science worked on the idea (Copernicus, Galileo, Kepler, Newton, Descartes, to name a few), and now the idea that the earth revolves around the sun is not particularly controversial. Uncontroversial that is until a certain someone needed to rhyme the word “earth” with the word “dirt”. Sigh.
Ben: Wow, you are way more forgiving of Jah’s lack of acceptance of one of the most basic principles of planetary orbit than I thought you’d be. It’s up to me to bring the pain.
First, let’s agree on this: this rhyming sequence is shoddy rubbish. It’s not that he uses “earth” to rhyme with “dirt” – it’s that he uses “dirt” to rhyme with “earth!” The nonsense bit of geocentrism kicks off the song’s third verse, and he rolls from that into “dirt,” “shirt,” and “hearse,” which is just a mess of a rhyming quatrain. And don’t try and tell me it’s an assonance. It isn’t.
There’s always an argument to be made about artistic license, but the rest of the verse is about guns… a word that already rhymes with “sun.” I feel this one could have been a quick fix.
Second, let’s expect more from Izzo, who proudly raps entirely off the top of his head and refers to himself as the “only n—– to rewrite history without a pen.” If you’re going to refer to yourself as an actual god, as you do in the first line of this very song, then at least meet the low standards we set for our third grade science classes.
Finally, you were 30 years old when you recorded this song, Mr. Hova. That is well past the date that you can refer to your reproductive parts as your “pee-pee.”
Bethany: It’s kind of hard to be harsh when you know there is no way someone would care about being corrected. I mean, this debate was settled 200 years ago. It’s not what he learned in school, it’s just willful ignorance. If I ran in to him, I’d probably just get something like this:
Ben: Truth. I would pay all the money in my bank account to have Jay-Z laugh the Jay-Z laugh at me.
Science by System of a Down Nominated Line: whole song
Bethany: Man, who went and pissed System of a Down off? With lines like “science has failed our world” and “science has failed to recognize the most potent element of human existence”, I feel equal parts defensive and apologetic. This might be a strongly religious song (“the spirit moves through all things” is repeated about a million times), I prefer the alternative explanation that Serj Tankian’s father was a robot who left he and his mother when he was a child.
Ben: It’s not just that this is a bad song (though it is), or that it’s anti-science to a truly alarming degree (though it is) – it’s the blatant lack of poeticism to the lyrics. It sounds like Serj wanted to see if he could write a song based entirely off the scribblings of a stoned high schooler’s Earth Science book cover. And I’m not sure he succeeded.
Mostly, I’m upset about the lack of evidence cited here, Serj. Tell us how science has failed us. Show your work.
Also, I set you up an appointment with the school counselor during your lunch break, just to make sure everything’s all right at home.
Bethany: I love how this series has taken Ben from a young and fresh-faced teacher to a grizzled veteran.
Radioactive by Imagine Dragons Nominated Line: whole song
Bethany: …..
…..
…..
…..
…..
…..
So, um, do I actually have to clarify that radioactivity does not cause muppet fighting pits? Because I’m happy to do that, but it seems like it should sort of go without saying. That video is really weird. I’m uncomfortable now. Here, have a video about the most radioactive places on earth while I go take a shower….a shower which, interestingly enough, would help me remove about 95% of radiation if I had actually been exposed.
Ben: I, for one, welcome our new muppet overlords.
There are real questions this video fails to address: how did muppet fighting pits begin? How was the pink bear granted his X-Manesque lazer abilities? If everyone is betting on the favorite, how is anyone making money on these fights? Why is everyone wearing cowboy hats?
More confusing is the behavior of the band, who has gotten themselves into a real pickle here. They’ve somehow become trapped in the basement of the muppet fighting arena, adjacent to but not connected with the muppet holding cell. They have their instruments with them, though they seem to have been taking very bad care of them – at this point, the drummer doesn’t even have any real drums, just barrels.
Even more concerning is the lack of awareness the band seems to have about basic radiation safety. The lead singer, Dan Reynolds, is literally sweating “rust,” which, when I ran it through WebMD, the site literally suggested I was having a brain aneurysm. The very next line, Reynolds announces he’s “breathing in the chemicals,” then we hear him take a deep breath. Guys: don’t do this.
On a probably related note, the song afterwards devolves into a collection of disparate actions so bizarre they defy interpretation. “I raise my flag, I dye my clothes, it’s a revolution I suppose.” Dude, if you aren’t sure, stop messing around with paint dye fumes and check yourself into a hospital. You really might be having an aneurysm after all.
Bethany: Oddly, I thought that line was one of the most straightforward and was just a 60s throwback/tie-dye reference. The rest sort of appears to be a fever dream of someone who just watched the Care Bears and the Deer Hunter back to back. Other than that Ben is completely correct. Chemicals, radioactivity, and laser beam teddy bears should not be messed with. Someone should make a gif-driven public safety video about this issue.
Ben: Challenge accepted. It’s our job to stop this before they conquer us all.
Ice Cream Freestyle by Flexmaster Funk or Canibus or Mike Tyson or something Nominated Line:“I can double my density from 360 degrees to 720 instantly.”
Bethany: Back when I was in engineering school, making sure you got your units right was a BIG DEAL. Like many other students, this admonishment from our teachers always felt a little pedantic to me. I mean, if I get the number you’re looking for then what’s the big deal? About a month in to my freshman year however, an incident occurred that forever changed my perspective on this: the loss of the Mars Climate Orbiter. For those of you not familiar with this, it was a $125 million dollar mistake that occurred when Lockheed Martin (the designer of the space craft) neglected to clarify with the NASA folks in Pasadena, CA whether or not everyone was using the metric system or the English system. Basically, the rocket was built on one set of units and run on another, the whole thing melted down and we flushed a substantial amount of money down the drain. The moral of the story was clear: units of measure matter.
Hopefully that explains why I absolutely cringed when I heard this lyric. While doubling 360 does in fact give you 720, density is not measured in degrees. Density is actually mass divided by volume, and this typically is expressed in kg/m3 or some other similar unit. Degrees is either temperature or used to measure mathematical angles.
Now interestingly, I found a few people arguing that the two lines are unrelated…that he’s claiming he can double his density AND go from 360 to 720 degrees. However, that would mean he’s just spinning around in a circle twice….which doesn’t seem like much to brag about. My preferred explanation here is that he’s actually referencing going from a wood like pine (about 373 kgs/m3) to oak (about 710 kg/m3). In the process of that, he’ll blow by 451 degrees, which is where wood starts to burn. What? It makes about as much sense as the original.
Ben: I haven’t been this confused since the Millenium Falcon made the Kessel run in twelve parsecs.
Math Suks by Jimmy Buffett Nominated Line: whole song
Bethany: Oh Jimmy. Oh Jimmy. I’d say I was mad, or disappointed, but the truth is….I’m not. This is pretty much exactly what I would have expected out of you. It’s tepid, it’s vaguely tropical, and it’s about as fun and spontaneous as mandatory Hawaiian shirt day at the local Honda dealership. Math suks? Okay, sure Jimmy. Whatever you say.
Have a rebuttal from a young and still uneven Jon Stewart in a segment called “Actually Math is Quite Pleasant“. He’s nowhere near his peak in this, but it’s about what you deserve.
Ben: Look at that dark-haired young Stewart, with his baggy suit and unfortunate shirt, talking to the camera over a horrendous graphics package! And the Huffington Post couldn’t write up a clickbait piece the next morning explaining how Stewart had “eviscerated” Buffett the night before. What a simple time that was.
Look, Jimmy has made quite a career of his “there’s nothing that can’t be solved by a margarita or three!” ethos, and I applaud him for it. There are times that blatant ignorance is charming, and that time is usually when everyone is lightly sunburned and clad in hideous shirts visible from space and a man turns a middle school refrain into a pleasant, touristy tune that can be played over the speakers of a Sandals resort.
On the flip side, the YouTube suggestions for videos to watch after this one were entirely for a college commencement speech that Buffett had given, which seems to be moving entirely out of his wheelhouse. Fortunately, the college in question was the University of Miami, so no harm done.
Bethany, I’m finishing my section in a sleep-deprived haze, so I’m not certain of what really happened during much of this debate. Was there really a teddy bear that could kill people with his lazer eyes? It all seems so unlikely.
Bethany: Oh it happened. By the way, am I the only one still surprised the song “Radioactive” was never featured on the O.C.? That’s the most O.C. song ever, and it pains me it came along 6 years too late to be the soundtrack for (spoiler alert) Marissa Cooper’s death.
Somewhat related, an interesting paper on the Gambler’s Fallacy with baseball umpires and asylum judges, among others.
James the lesser passed on this interesting link about that “simple abstracts get cited more often” paper. There was a lot of assumptions going in to the model that came to that conclusion right there, and we all know those never go wrong.
Speaking of abstracts, this post on how to read a scientific paper was really good.
There was an interesting discussion over at West Hunter recently about the replication crisis in social psychology. In the comments section there was a lot of discussion about learning statistics and if that would help people think more rationally or not. I thought of that when I ran in to this article (about a year old) attempting to coin the term “dysrationalia” for those who are intelligent, but have trouble being rational. I need to start using that phrase.
Scientist by Dandy Warhols Nominated line: whole song
Bethany: Wow, when Ben nominated this song, he mentioned there was not much too it. Having now listened to it and reviewed the lyrics….he’s completely right. This song keeps seeming like it will ramp up in a clever reference or two, but it pretty much stops at “we’ve got to live on science alone” and some grunting. Also, at the 6 second mark the girl in the video drinks something directly out of a beaker, and that’s just not safe. I’m starting to doubt her credentials.
Ben: I also have real questions about her decision to avoid wearing safety goggles and spend her lab hours lounging on a uncomfortable-looking couch licking her lips at the camera. How did she ever find the time to finish her graduate degree? Her work ethic seems questionable, and her lab seems to exist solely of two beakers and a microscope. Maybe it’s a lack of funding.
I do like the Dandy Warhols, but this is a blah nothing of a song and a blah nothing of a music video, so it gets the blah nothing of a review it deserves.
Bohemian Rhapsody by Queen Nominated line: “Thunderbolts and lightning very very frightening Galileo Galileo Galileo” (3:17 mark)
Bethany: Okay, there’s a strong argument to be made that this song should never appear on any list that includes the words “meh” or “mediocre”. I mean, it’s a great song and it was awesome in Wayne’s World. I get that. I really do. HOWEVER….this science reference is pretty lame. While Galileo is an awesome historical scientific figure and his contributions to science are many, he does not appear to have done any particular work on thunderbolts, lightening, things that were very very frightening or Figaro.
Scratch that: Galileo did champion heliocentrism, which was very very frightening to some. I also like to hold out hope that there’s something very frightening on one of Jupiter’s moons, which he also discovered.
Ben: The problem with discussing “Bohemian Rhapsody” is that it’s impossible to talk about for more than two minutes without someone jumping in with a “GALILEO! [distant voice] galileo! GALILEO! [even more distant voice] galileo!” and then someone else coming in with “GALILEO FIGARO!” and all of a sudden it’s a contest to prove that you can sing all the lyrics all the way up until the end and I’ve lost nine minutes of my life and gotten kicked out of Arby’s.
I appreciate that Galileo discovered Jupiter’s moons, since most of our best moons are up there.
Current Moon ranks:
1. Titan, orbiting Jupiter. It’s massive, has weather, and might be a second earth.
2. Europa, orbiting Jupiter, which has a vast frozen ocean underneath.
2. Our moon, but the way poets talk about it.
3. Charon, orbiting Pluto. The best moon an ex-planet could ever have. At least they have each other.
4. Io, orbiting Jupiter, which has hundreds of active volcanoes.
5. Our moon, but the way Buzz Aldrin thinks about it.
6. Triton, orbiting Neptune. Also gigantic, and deserves to be a planet. Got a raw deal by orbiting Neptune.
7. Our moon, but the way Dean Martin thinks about it.
8. Mimas, the moon that looks like the Death Star.
9. The brief stretch we thought the Death Star was a small moon.
10. A harvest moon.
57. Phobos, orbiting Mars. If we ever fly to Mars, we’ll probably land on it first. Has no other interesting qualities of any kind.
314. Supermoon. Supposed to be impressive, but always disappointing. The Fourth-of-July parade of moons.
Bethany: So I promised up front I was going to get a little bored and space out with the meh list….BUT NOW WE’RE RANKING MOONS AND I WANT BACK IN!!! Not only am I angry with myself for not doing this before Ben did, but now I’m in “scrambling for an angle” mode. The first thing I can think of is the best moon gifs I could find on short notice:
4 of Jupiter’s moons, including Callisto and Ganymede that are feeling a little put out at Ben right now:
Jupiter and Io, just hanging out being cute:
Our moon rotating and showing us it’s dark side and reminding me we left Pink Floyd off this list by accident:
This one, that shows moon gravity and why I should stick to earth:
Okay, I feel better now.
Race For the Prize by The Flaming Lips
Nominated Line: whole song
Bethany: So this song is a thoughtful meditation on scientist engaged in a race for the good of all mankind. It’s beautiful, inspiring, and really dramatizes and humanizes scientists and their struggle. So what’s my problem?
I don’t know what it’s about.
Seriously. Watch the video. There are guys running with electrodes attached and men in raincoats with tubas, but no explanation. There’s a suggestion they’re looking for a cure, but for what? Are we supposed to believe this is just how everyday scientist operate? Because it’s really not. Who are these guys? This is like having a friend tell you an awesome story about a run in with a celebrity, only to tell you that they can’t actually legally name the celebrity. NO TELL ME THE WHOLE THING OR DON’T TELL ME THE STORY.
Ben: I like that the scientists chose to have their subject run outside, attached to a number of diodes, while they pursued him on foot wearing full-body chemical suits, but no facial protection of any kind. It’s guerrilla science. Sure, their data is unusable and they used up all their grant money, but THEY COULD FEEL THE SCIENCE IN THEIR HAIR AS THEY RAN.
I have no idea what this song means, either, but I find it somehow moving anyway. I don’t know how Wayne Coyne’s voice always does this to me. Also, who gave Wayne Coyne a trumpet for this video? Did Wayne Coyne also not know what to do with his hands? Is this how we eventually ended up here?
You stay you, Wayne.
Video Killed the Radio Star by the Buggles
Nominated Line: whole song
Bethany: This is another song I hate to criticize because it got used well in a movie I love, but my art compels me. This is not a song about science. This is a song about the impact developing technology has on the experience of day to day life. While that’s cool and all, it’s really more a philosophical and ethical issue than a science issue. I really hate it when people try to use the two interchangeably. That’s physics for poets level crap right there. To get to the pantheon, this song would have to actually cite some of the technology used. I mean, the only advancement specifically called out is the VCR? Come on, you can do better than that. Granted not much rhymes with “farnovision“, but you could have worked something in.
Ben: Well, I might have taken some shots at this song earlier, but your intro got me into an entirely different moves. I can’t take shots at “Video Killed the Radio Star.” Not today…
This song, permanently famous for its portentous place in MTV history, is a catchy bit of pop made by a producer who felt the winds of change coming long before they actually did. It’s so perfect as a metaphor for what happened to pop music in the following decades that it seems impossible that it really existed in its real time and place, and wasn’t written snidely after the fact as a commentary on the effects of the need for pretty faces and flashy visuals.
That said, Bethany is right. There’s no science here, unless the “supernova scene” is something much more impressive than what I imagine it to be. It’s only tangentially connected to the subject at hand, and as such, it only gets partial credit.
Bethany: Wait, what if that Supernova Scene involves a Champagne Supernova?
Also, pedants note: The line “Supernova Scene” was not in the original, but rather in the POTUSA cover.
Space Oddity by David Bowie
Nominated Line: whole song
Bethany: Since I’m yet again complaining about a great song that simply doesn’t have enough “science” for me, I thought I’d point out that I know how ridiculous I sound:
That’s me and this song. I like you David Bowie, but you call your ship a tin can. No comment on the technological marvel that got you 100,000 miles away from earth? Your only comment on your view of earth is “it’s blue”? Really? And you’re meditating on your death and your love for your wife but not one word on what possible mechanical failure precipitated all these thoughts?
I really don’t understand why anything with even the briefest of references to something vaguely scienc-ey gets called a science song. I mean, we don’t cite “Charge of the Light Brigade” as a primer on international relations, so lets just all admit “Space Oddity” has very little to do with science.
Ben: First off, let’s give a quick doff of the cap to longtime Earth resident and almost certain alien, David Bowie, who is no longer with us and has likely returned to his home world.
Second, ALLOW ME TO CORRECT YOUR SCIENCE, BETHANY. During the period of space travel that Bowie was singing about, the walls of the Saturn rockets were basically made of reinforced aluminum foil. His comparison to a tin can is apt both in visual and in practice – an aluminum soda can’s experior is about .1 mm thick, parts of the Saturn shuttles were a mere .3 mm thick. Our early astronauts really were barely more than a hairsbreadth away from outer space.
Not to mention, the Earth does look awfully blue when seen from space. And, should I ever find myself in a situation where my spaceship tumbles endlessly away from earth to my certain death, I should be pleased if my last thoughts were with those I love rather than whatever cataclysmic event had caused my death. There’s no poetry in “Though I’m past one hundred thousand miles, I’m feeling very still, and it looks like an oxygen tank has exploded and I’ve lost control of my thrusters, the hull is breached and the cabin is decompressing, I’m certain to die of oxygen loss in just a few minutes now.” At least not without a good backbeat to it.
Putting this one in the anti-science camp is the fact that it sprang from Bowie going to see 2001: A Space Odyssey“several times, stoned out of my gourd.” So maybe let’s call this one a draw.
Bethany: You’ve kind of sold me. I feel like this is one of those songs that if I’d put it on the good list I’d regret it, and now it’s on this list and I regret it. Like many a straight man in the 70s, Bowie has left me with confused feelings of uncertainty where I’ve never had them before. I’ll give him an A-, but if any of his friends try to pass in similar work they’ll have a C so fast it’ll make their head spin.
Ben: That about wraps us up for the week. It’s downhill from here, right, Bethany?
Recently I had a discussion with a friend from childhood who is now a teacher. She had liked my “Intro to Internet Science” series, and we were discussing the possibility of me coming and chatting with her AP chemistry class about it. We were discussing time frames, and she mentioned it might be best to come in April when the kids started writing their thesis. “Every year they get upset I won’t let them use blog posts instead of peer-reviewed journal articles.” she said.
Oh boy. As a long time blogger who likes to think she’s doing her part to elevate the discourse, let me say this clearly: NEVER CITE A BLOG POST AS A PRIMARY SOURCE. Not even mine. Here’s why:
Anybody can be a blogger. One of the best things about blogging is that it’s an incredibly easy field to enter. It takes less than 15 minutes to set up a blogger or WordPress account and get started. It takes about $20 to register a custom domain name. This is awesome because you can hear lots of voices on lots of topic you wouldn’t have otherwise had access too. This is also terrible because there are lots of voices on lots of topics you wouldn’t have otherwise had to deal with.
Nothing stops people from fabricating credentials, using misleading titles or just flat out making stuff up. Don’t believe me? Health and wellness blogger Belle Gibson built an enormous empire based on her “I cured my cancer through whole foods” schtick…..only to have it revealed she never had cancer and had no idea what she was talking about.
Peer review isn’t perfect, but any deception perpetrated in published papers will have taken a huge amount of time to pull off. Simply out of laziness, that means there will be less outright fraud (although it does still happen).
No one checks bloggers before we hit publish. Like many bloggers, I do most of my blogging late at night, early in the morning or on weekends. I have a full time job, a husband, a child, and I take classes. I’m tired a lot. Despite my best intentions, sometimes I say things poorly, let my biases slip in, or just do my math wrong1. I happen to have smart commenters who call me out, but it’s plausible even they miss something.
I try to adhere to a general blogger code of conduct and provide sources/update mistakes/be clear on my biases when I can, but I will not always be perfect. No one will be. With peer-reviewed papers, you know MANY people looked at the papers before they went to press. Doesn’t make them perfect, but it does mean they’ll far less likely to contain glaring errors before publication.
Blog posts can mislead. While many bloggers are driven by nothing more than a desire to share their thoughts with the world, many are doing it for money or other motivations. Assuming that blog posts are actually marketing tools until they prove otherwise. I wrote a whole 10 part series on this here, but suffice it to say there are many ways blog posts can deceive you or make things sound more convincing than they are.
Science changes, but the internet is forever. Even if you find a good solid blog post from a thoughtful person who cited sources and knew what they were talking about, you’re still not out of the woods. The longer the internet sticks around, the more things will outdate or need updating, even if they were right at the time the author wrote them. I’ve started a series where I go back to posts I wrote back in 2012/2013 and update them with new developments, but nothing will stop Google from pulling them up in search results as is.
Using blog posts robs you of a good chance to learn how to read scientific papers. Reading scientific papers is a bit of an art form, and it takes practice. Learning how to find critical information, how to figure out what was done well (or not at all!), and doing more than just reading the press release can take some practice. Everyone has a slightly different strategy, and you’re not going to find the one that works for you unless you read a lot of them. If you’re still at the point in your life where you have external motivations to read papers (like, say, a teacher requesting that you do it), take advantage of that. It’s a skill you’ll value later, one of those “you’ll thank my when you’re older” things.
In conclusion: One of my favorite blog taglines ever is from Scott Greenfield’s Simple Justice blog “Nothing in this blog constitutes legal advice. This is free. Legal advice you have to pay for.” Same goes for science blogging. If it’s free, you get what you pay for.
1. I’m actually perfect, but I figured I’d throw the hypothetical out there.↩
Bernoulli Distributions are for single events that can either succeed or fail….think a coin flip. By themselves they don’t describe much, but are the basis of many more complicated distributions.
Well hello there! After spending two weeks and 3000 words praising various songs for getting science right (Part 1 here and Part 2 here), we’re now moving a step down the ladder to the decidedly mediocre. These are the songs that reference science and aren’t really wrong, but aren’t overly inspiring or interesting either. While some of these are great songs, just know that through most of this my face resembles a bored professor teaching general science requirements to liberal arts major freshmen who didn’t figure out how to test out. For those of you never in that situation, it’s just an inner scream that looks like this:
The Math by Hilary Duff
Nominated Line: whole song
Bethany: Despite the promising title, this is a song that clearly exists because one of Hilary Duff’s songwriters had a crush on a guy who was smarter than her. She tries to explain love to him in terms of mathematics, but it’s the kind of math references anyone who’s passed 3rd grade would understand. Addition. Subtraction. Equal signs. THIS ISN’T GOING TO WORK HILARY. We math geeks love our references, but we like them at a level that requires more than a primary school education.
You can still turn this around though….do a follow up that references how much you’ve learned then say things like “You say it’s time to go, but with convolution time doesn’t matter”. That’ll get ’em.
Barring that, I can only say this: Why can’t you be more like that nice Josh Ritter fellow Ms Duff?
Ben: Bethany referenced Duff’s songwriters in her paragraph, which means I have to do the research into the recording of this Hilary Duff album, which was not the sort of thing I thought I signed up for.
A short history: “The Math” was recorded for the release of Hilary Duff’s first real pop album, the recording of which sounds like the sort of well-paying migraine you sign up for when you become a pop producer. Apparently, at the launch of this process, Duff was a Disney TV star who decided she wanted to become a singer because she saw pop musicians warming up before a show and it “looked fun.” A Disney executive signed her, had her start voice lessons, and launched a multi-million dollar recording session. Somewhere out there, Robert Johnson’s soul just moaned in eternal torment.
Recording was immediately troubled because Duff was “listening to a lot of Destiny’s Child at the time” (weren’t we all), so the songs had an “urban style” to them that apparently “didn’t strike a chord,” according to one of the producers. From what we know of Duff’s artistic range, I assume this is a breathtakingly dramatic understatement.
At this point, her producer asked her “what kind of music she would like to do,” which is not normally the sort of conversation one has halfway through a recording process. She mentioned that growing up, she’d “listened to a lot of rock music,” (I genuinely do not want to know who she means) and liked songs that had “a little bit more guitar in it.”
Enter Kara DioGuardi – yes, that Kara DioGuardi! Onetime American Idol judge/reluctant bikini model Kara DioGuardi! – who had written demos for a number of songs, including future Duff singles “Come Clean” and “Little Voice.” Duff recorded these as demos, and they were sent to the studio, along with “The Math,” which was not sung by Duff at all but by prolific songwriter Lauren Christy. The studio loved all three songs and the new direction, and Duff was forced to add all three to her new record.
Forced? Yes, evidently, Duff feels the same way about “The Math” that the rest of us do, calling it “her biggest mistake,” which is very strong language for someone who dated both Joel Madden and Aaron Carter. Of course, when you listen to the pop-guitar buzz and word vomit that makes up “The Math,” one understands exactly where she’s coming from.
Also, for our younger reader, to “star 69” someone meant to type that exact sequence into your phone’s touchtone pad, which would then make the landline you were on call the last person who had called you back. What a weird, old-timey thing to do! Anyway, it’s not sordid or anything. Hilary kept it clean.
Bethany: Whoa. I think you put more effort in to that part than went in to the entire song to begin with. Good show.
Rest my Chemistry by Interpol Nominated Line: “I’m going to rest my chemistry”
Bethany: Okay, Ben’s going to have to explain this one to me. This song uses the word “chemistry” ten times and doesn’t say anything about the subject. In my world, that’s just name dropping.
Ben: As best I can tell, to “rest my chemistry” means to “not take any cocaine, at least right at the moment.” It’s like when celebrities go to rehab for “exhaustion.”
As Interpol songs go, this is fine, but it carries no weight next to, say, “Evil,” their hook-laden hit with the bizarre puppetry music video. Frankly, putting “Rest My Chemistry” in this group feels right – it’s a tune with a vague acknowledgement of the chemical makeup of the world around us, but without any actual, you know, science.
Bethany: Glad we’re on the same page here. B- to Interpol because I just don’t want to see them again next semester.
Ben: Boy, if retaking the course comes into consideration, that’s going to dramatically affect the scores the groups we’re covering in the sections to come. Unless the dean just happens to find some contraband in Thomas Dolby’s locker, of course…
She’s Electric by Oasis
Nominated line: “She’s electric, can I be electric too?”
Bethany: Just so we all know I can criticize things I love, let’s talk about this song. Noel repeats over and over how electric this girl he likes is. This is all well and good, but then he starts wanting to be electric too. This clearly goes against all electrical safety precautions, where the goal is to not electrocute yourself along with the person you’re trying to help. It’s like he knows how it works, but like a 12 year old in his first hands on lab wants to do the exact wrong thing with the information.
On the other hand, this could be turned around with the right visuals. This could totally work in concert:
Except make it more British-ey.
Ben: I don’t know what that visual is, but I found the perfect British person to design it.
“She’s Electric” is full of bad ideas. This woman has a sister, and “God only knows how he missed her.” It seems exceptionally unwise to get involved in a relationship where you wish you’d had a go at her sister, but now it’s too late. What’s more, he doesn’t get along with her brother, who quite wisely doesn’t trust Noel, since he also has taken a fancy to their mother. Meanwhile, the girl in question is pregnant with someone else’s child, which wouldn’t be outrageously concerning except that he only mentions it in conjunction with the fact that she has a lot of cousins, making an uncomfortable inference about the perhaps-too-close relationships that hold this familial group together.
Most importantly, he’s not showing proper electrical safety, and that’s the most major concern. Noel, you know full well what’s going to happen if you try to end up “electric too.”
*
*Note: possibly not 100% scientifically accurate.
Noel, take my advice. Get out of there. She’s no good for you. This is a nightmare waiting to happen. But if you must, handle her carefully, and try to move her away from any electric current with a broom, like this:
Readers, if only we were all so wise.
Bethany: Ben, I see a future for you in gif-driven public safety educational videos. It’s a calling.
Ben: I probably can’t make a career out of it, but I’ll change my twitter bio anyway.
Man on the Moon by R.E.M.
Nominated line: “Newton got beamed by the apple good”
Bethany: This line has always bothered me. Why is it there? It’s not interesting, it’s not inspired, it’s a scientific reference only in the loosest sense of the term. Isn’t this a song about Andy Kaufman? Why are we talking about Newton and apples? The story about how he discovered gravity is really famous and possibly apocryphal, but everyone knows this. What does it teach us? We get a complete biography of Kaufman in under 5 minutes and then a 5 second muttering about Newton and apples? Michael Stipe, you disappoint.
Ben: Boy, you were grouchy on this one. Until I fixed it, you’d managed to both get the name of the song wrong and misspell “R.E.M.” That’s some uncharacteristic negligence. Looks like it’s up to me to defend our favorite Georgian college-rock band.
It’s tough to make too much out of this one. “Man On The Moon” was the last song recorded for R.E.M.’s masterwork album Automatic For The People, and the lyrics of it came at the very last minute. The entire album had been finished and was to be sent for mastering the next morning. They had recorded music for “Man On The Moon,” but the song was still without vocals, or indeed, lyrics. Michael Stipe, stymied by writer’s block for weeks, walked around the block, listening to the track, and decided to write the lyrics as a song about Andy Kaufman. The lyrics were written and the vocals recorded only a few hours later.
Or, at least, that’s what Michael Stipe says. Stipe, like Kaufman, was prone to inventing stories as a form of self-glorification, and enjoyed playing fast and loose with the truth. Much like Newton’s possible mythical apple, we will never know the veracity of the story.
In fact, that’s most likely the reference Stipe is making here: Newton’s apple, Moses bringing forth water from his stick, Cleopatra being bitten by an asp – are these historical events or falsehoods accepted as realities? Stipe even questions Kaufman’s own death – “here’s a truck stop instead of St. Peter’s” – a nod to how Kaufman’s propensity for taking a joke too far led to his fans never being quite able to accept that he was dead.
As usual, R.E.M.’s penchant to meander along line between cleverness and ambiguity is well covered over by their ear for melody, since this is a hall of fame pop song no matter how well you understand the lyrics. That baseline is an all-timer.
She Blinded Me With Science by Thomas Dolby
Nominated Line: whole song
Bethany: Okay, if you thought I was grouchy about R.E.M., it’s nothing compared to my feelings about this Dolby song. Let me say this once, very clearly, so there’s no misunderstanding: THIS. IS. NOT. A. SCIENCE. SONG.
It’s not. It’s a high school kid reading his course schedule. It’s not fit to graduate, let alone be considered an anthem. This song is like a singer yelling “WHAT’S UP INSERT RELEVANT CITY NAME HERE” at a concert. There are subjects named, but no actual science….and yet because it says SCIENCE loudly and over and over, somehow it’s become part of the pantheon. Are we nerds so bad off that we will accept this kind of thing? Guys, we have to expect better than this. We’re worth it.
Ben: I was utterly unfamiliar with Mr. Dolby and his scientific affectations, and so watching the music video for this song was a bit of a rude awakening. This song is everything I dislike about pop music in the 80’s, from the off-puttingly banal Mad Lib lyricism, to the bewildering shouts of British television science enthusiast Magnus Pike, to (above all) the brain-curdling synth track, with its entirely electric violin sound fooling no one (Dolby at one point plays an actual violin in the video, and later rubs a bow across an actress halfheartedly painted to look like a violin. In neither action is he convincing).
What’s odd is that despite the song’s utter ineptitude at expressing coherent scientific thought, Thomas Dolby’s resume is somewhat reasonably accomplished. He’s an accomplished session musician, been the musical director at the TED Conference since 2001, and is now a professor of the arts at Johns Hopkins. However, it seems that rather than his hit single being the culmination of a lifetime understanding of science, his odd one-hit wonder led him to become the poster boy for science and music, and respectability followed.
The music video for this song – also featuring the truly bizarre Magnus Pike – is a mashup of every bit of awful 80’s-ness: an unappealing frontman in an unappealing outfit, frantic camera zooms, an attractive woman wearing glasses in “sexy scientist” vibe, a low angle shot of just a woman’s legs, the unjustified used of children dressed up as adults, and a film reference (the text slates seen in silent films) used with hammering clumsiness. The peak moment of this is one of the video’s final slates:
Nerds of the world: you do not want this song representing you.
In my perusal of Mr. Dolby’s Wikipedia, I also found this:
The only thing less surprising to me was discovering that this song went to number one in Canada. Stop playing into our conceptions of you, Canucks!
That’s all I’ve got this week. Bethany?
Bethany: Until next week and Part 2, I’ll just be here doing my nails.
A reader named Doug has sent me a couple of awesome articles about p-values (thanks Doug!) and why we should regard them with suspicion. As often happens with these things, I subsequently tried to explain to someone unfamiliar with stats/math why this is such an interesting topic that everyone should be aware of and realized I needed a whole blog post.
While most people outside of research/stats circles won’t ever understand the math part of a p-value calculation, it’s actually a pretty important concept for anyone who wants to know what researchers are up to. Thus, allow me to go all statsplainer on you to get you up to speed.
Okay, so why are you anthropomorphizing p-values and accusing people of being mad at them?
P-values and the calculation thereof are a pretty fundamental part of most basic statistics courses, so to see a large group of statisticians push back against their use is a bit of a surprise.
Gotcha. So the people who taught us to use them in the first place are now telling us to watch out for them. Fantastic.
Yeah, they kind of acknowledge that. Their paper on the issue actually starts with this joke:
Q: Why do so many colleges and grad schools teach p=0.05 A: Because that’s still what the scientific community and journal editors use
Q: Why do so many people still use p=0.05 A: Because that’s what they were taught in grad school
That’s a terrible joke. I’m not even sure I get it.
Yeah, statistical humor tends to appeal to a limited audience. What it’s trying to point out though is that we’ve gotten ourselves in to a difficult spot by teaching “what everyone does” and then producing a group of people who only know how to do what they were taught.
Okay, that makes sense I guess…but what does the whole p=0.05 thing even mean?
Well, when you’re doing research, at some point or another you’ll want to do something called “hypothesis testing”. This is the basis of most published studies you hear about. You set up two opposing sides, formally called the null and alternative hypothesis, and then you figure out if you have the evidence to support one or the other.
The null hypothesis H0, is typically the theory that nothing interesting is happening. Two groups are equal, there’s no change in behavior, etc etc.
The alternative hypothesis Ha, is typically the theory you REALLY want to be true…at least in terms of your academic career. This would mean that something interesting is occurring: two groups are different, there’s a change in behavior, etc etc.
Okay, I’m with you so far…keep going.
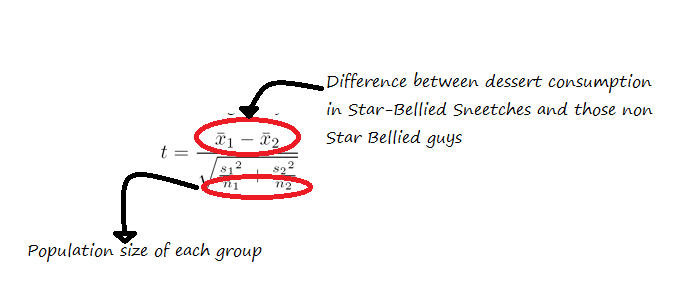
This next step can work differently depending on the experiment/sample size/lots of other details, but lets say we’re comparing Star Bellied Sneetches to those without stars on their bellies and seeing if the groups eat a different amount of dessert. After we calculated the average dessert eaten by both groups, we would calculate something called a t statistic using this equation.
Once we have that value, we take the amusingly old school step of pulling out a table that looks like this, and then finding the value we want to compare our value to.
Okay, so how do we figure out where on this table we’re looking?
Well, the degrees of freedom part is another whole calculation I threw in just to be annoying, but the other part is your α, or alpha. Alpha is what we’re really referencing when we say p=0.05….we set our significance level (or alpha) at .05, so now that’s what we’re aiming for. If the value we calculated using that equation up there is larger than the value the table gives, then it’s considered a finding significant at the level of alpha.
I think I lost you.
That’s fine. Most stats software will actually do this for you, and spit out a nice little p-value to boot. Your only decision is whether or not the value is acceptable. The most commonly used “significant” value is p < .05.
Okay, how’d we pick that number?
Arbitrarily.
No really.
No, that’s really it. This is why that joke up there was funny. After all the fancy technical math, we compare it to a value that’s basically used because everyone uses it. Sometimes people will use .1 or .01 if they’re feeling frisky, but .05 is king. There’s even an XKCD comic about it:
In theory, the p-value should mean “the chances we’d see an effect larger the one we are seeing if the null hypothesis was true”, but the more people aspire to the .05 level, the less accurate that becomes.
Why’s that?
Well, a couple reasons. First, the .05 value will always mean that 1 out of 20 p-values could be due to chance. For some studies that gather a lot of data points, this means they will almost always be able to get a significant finding.
This tactic was used by the journalist who published an intentionally fake “chocolate helps you lose weight” study last year. He did a real study, but collected 18 different measures on people who were eating chocolate, knowing that chances were good that he would get a significant result on one of them. Weight loss ended up being the significant result, so he led with that just downplayed the other ones. Other researchers just throw the non-significant effects in the drawer.
There’s also the issue of definitions. It can be really hard to grasp what a p-value is, and even some stats text books end up saying wrong or misleading definitions. This paper gives a really good overview of some of the myths, but suffice it to say the p-value is not “the chance the null hypothesis is true”.
Okay, so I think I get it. But why did the American Statistical Society speak out now? What got them upset?
Yeah, let’s get back to them. Well as they said in their paper, the problem is not that no one has warned about this previously, it’s that they keep seeing the issue. Their exact words:
Let’s be clear. Nothing in the ASA statement is new. Statisticians and others have been sounding the alarm about these matters for decades, to little avail. We hoped that a statement from the world’s largest professional association of statisticians would open a fresh discussion and draw renewed and vigorous attention to changing the practice of science with regards to the use of statistical inference.
As replication crises have rocked various fields, statisticians have decided to speak out. Fundamentally, p-values are really supposed to be like the SAT: a standardized way of comparing findings across fields. In practice they can have a lot of flaws, and that’s what the ASA guidance wanted to point out. Their paper essentially spelled out their view of the problem and proposed 6 guidelines for p-value use going forward.
And what were those?
P-values can indicate how incompatible the data are with a specified statistical model.
P-values do not measure the probability that the studied hypothesis is true, or the probability that the data were produced by random chance alone.
Scientific conclusions and business or policy decisions should not be based only on whether a p-value passes a specific threshold.
Proper inference requires full reporting and transparency
A p-value, or statistical significance, does not measure the size of an effect or the importance of a result.
By itself, a p-value does not provide a good measure of evidence regarding a model or hypothesis.
They provide more explanation in the paper, but basically what they’re saying is what I was trying to get across above: p-values are useful if you’re being honest about what you’re using them for. They don’t tell you if your experimental set up was good, if your explanation for your data is reasonable, and they don’t guard against selection bias very well at all. The number “.05” is good but arbitrary, and the whole thing is a probability game, not a clear “true/false” line.
Okay, I think I get it….but should statisticians really be picking on other fields like this?
That’s a good point, and I’d like to address it. Psychologists don’t typically walk in to stats conferences and criticize them, so why do statisticians get to criticize everyone else? Andrew Gelman probably explains this best. He was one of the authors on the ASA paper, and he’s a baseball fan. In a post a few months ago, he said this:
Believing a theory is correct because someone reported p less than .05 in a Psychological Science paper is like believing that a player belongs in the Hall of Fame because hit .300 once in Fenway Park.
This is not a perfect analogy. Hitting .300 anywhere is a great accomplishment, whereas “p less than .05” can easily represent nothing more than an impressive talent for self-delusion. But I’m just trying to get at the point that ultimately it is statistical summaries and statistical models that are being used to make strong (and statistical ridiculous) claims about reality, hence statistical criticisms, and external data such as come from replications, are relevant.
As Bill James is quoted as saying, “the alternative to good statistics isn’t no statistics…it’s bad statistics.”
Got a question you’d like an unnecessarily long answer to? Ask it here!
This is Part 2 of our piece on “Ten Songs That Get Science Right”. Missed Part 1? Read it here.
“Champagne Supernova” by Oasis Nominated Line: “Like a Champagne Supernova in the sky”
Bethany: I loved this song in high school. In fact I loved this whole band, and even in 2016 two out of the last three concerts I’ve been to are Noel Gallagher concerts. Conflict of interest aside, that’s not why this made the list. It made the list because it’s the only song I know of that actually summoned the scientific phenomena it referenced in to existence….or at least got something really cool named after it. Basically, when this song was released in 1996, the term Champagne Supernova had no real astronomical meaning. That changed in 2006, when researchers discovered a supernova that exceeded the Chandrasekhar limit and decided that “extreme explosions that offer new insight into the inner workings of supernovae are an obvious cause for celebration”. Ergo, they dubbed it a “champagne supernova”. And yes, they clarified they did know the song and it was not a coincidental naming.
Can’t wait to see what a Wonderwall turns out to be.
Ben: Donald Trump is building it right now.
As someone who just aggressively defended my BNL fandom, I’m not going to sit idly by and let you feel exposed by expressing your love of Oasis and one of the Gallaghers, though I coudn’t remember which one was the good one, so I had to Google it.
I’m pretty sure I disagree with this – I like Noel Gallagher’s High Flying Birds more than I like Beady Eye – but I’d be much more interested in the opinions of my more versed colleague.
Perhaps* I am biased, but I think 90’s alternative rock has aged much better than most genres, and Oasis has aged as well as anyone. Both “Wonderwall” and “Champagne Supernova” are still magnificent recordings, and both deserve to have pieces of scientific wonder named after them into time immemorial, even though spending more than an hour or two in either brother’s presence seems like a fate nigh unto death.
*unquestionably
Bethany: You don’t have to defend me. My love for somewhat whiny British men with livers of steel is not a thing I’m ashamed of. Also, my google says this:
C₁₁ H₁₇ N₂ O₂ S Na by Anthrax Nominated Line: Song Title
Bethany: Do I even have to explain my love for this? It’s a chemical formula. Who puts a chemical formula for their song title? The same guy who named his bio “The Story of That Guy From Anthrax” that’s who. Anyway, that’s the real formula for sodium pentathol aka “truth serum” and the whole song is about wishing you could force someone to tell the truth. No further science references at all, just a chemical formula you have to google. While in reality sodium pentathol probably doesn‘t work that well, I’ll let that slide as poetic license.
Ben: Well, this led me down a whole rabbit hole of the history of sodium pentathol and its use in police confessions, and eventually to the bizarre case of Sybil Dorsett, a fascinating story that I will never be able to work into a conversation as long as I live.
I’m no particular fan of thrash metal in any context, though Anthrax is one of the better examples of the genre, and I appreciate the cleanliness of the recording rather than hiding a lack of musicianship behind fuzz. The thing I like the most about the song is that it was recorded in 1993 – therefore, Googling or even Altavista-ing the song title was out of the question. You had to know someone else who knew what it meant, or go to an actual library. Anthrax: supporting libraries!
Well, they always did seem like a studious lot.
“Stuck To You” by Josh Ritter Nominated Line: whole song
Bethany: I will admit, I had never heard this song before Ben put it on the list. Color me ashamed. This is every pedantic nerds dream song, wherein a man takes common love song cliches and corrects them with more scientifically accurate answers. It’s a beautiful thing, and a little more elaborate than just declaring someone your statistically significant other.
Ben: I found this one on a hunt for “science songs,” and while I’d listened to a fair bit of Josh Ritter before, I’d never stumbled across this one. It’s a neat, concise statement that’s both tongue-in-cheek and mournful, like a lot of folk songs used to be. I wish more artists had this sort of song in their quiver.
Bethany: Especially once we get to the next section, we’re going to look back at this song wistfully. Spoiler alert: I will definitely use the line “Why couldn’t you be more like that nice Josh Ritter fellow Ms Duff” at some point.
“The Elements” by Tom Lehrer Nominated Line: whole song
Bethany: How can we do a “best of” list and not include the Elements Song? I mean, I spent a whole day at my grandfather’s house one summer attempting to memorize this in the days before DVR and easy rewind. I think I broke his VHS, and he made me watch Pirates of Penzance as penance. Anyway, this was written in 1959 and it falls 16 elements short of today’s periodic table….but it’s still a great song. Damn catchy too.
Ben: My dad and I used to listen to old comedy records together in our living room, which is a very old-fashioned thing for someone who is technically considered a Millennial to say. One of the ones we played most frequently was An Evening Wasted With Tom Lehrer, which contains such ditties as “Poisoning Pigeons In the Park,” “The Masochism Tango,” and also “The Elements,” which I saw no less than three different math majors perform at talent shows while in college. Singing all the words to this song aloud is the nerd equivalent of peacocking. In fact, here’s Daniel Radcliffe doing it right now!
Whoops, ended up on a whole celebrities-rapping-on-talk-shows YouTube jag. Got distracted there for a minute.
“Girl You Have No Faith In Medicine” by White Stripes Nominated Line: whole song
Bethany: I’m not entirely sure about this song, but I think I like it. It appears to be a song about placebo effects, drugs that work, and people who won’t take drugs that are too familiar because they need something different. I put it on repeat for an hour to see if I ended up feeling differently, and I didn’t. I think this is an anti-alternative medicine theme song. Probably.
Ben: Like all White Stripes songs, your mileage is going to vary considerably depending on whether what Jack White does is your jam or not. I dig the White Stripes, but I have no particular feelings towards this song one way or the other. I think it fits neatly into the album, because I recall liking Elephant very much, but that was a long time ago.
I was surprised that you didn’t break down the “strip the bark right off the tree and hand it this way” line (Aspirin is made from the bark of a willow tree). That seemed like your lane.
Bethany: Ben, aspirin hasn’t been made from willow bark since the late 1800s. Don’t be a hippie.
Ben: I probably shouldn’t have forged that pharmacist’s license, then. Someone’s bound to catch on eventually.
Well, that covers the good songs, so I’m expecting this to get meaner as it goes. I’m looking forward to it.


 *
*