Food Insecurity: A Semester in Review

I mentioned a few months back that I was working on my capstone project for my degree this semester. I’ve mostly finished it up (just adjusting some formatting), so I thought it would be a good moment to post on my project and some of my findings. Since I have to present this all in a week or two, it’s a good moment to gather my thoughts as well.

Background:
The American Time Use Survey is a national survey carried out by the Bureau of Labor Statistics that surveys Americans about how they spend their time. From 2014-2016 they administered a survey module that asked specifically about health status and behaviors. They make the questionnaire and data files publicly available here.

What interested me about this data set is that they asked specifically about food insecurity….i.e. “Which of the following statements best describes the amount of food eaten in your household in the last 30 days – enough food to eat, sometimes not enough to eat, or often not enough to eat?” Based on that data, I was able to compare those who were food secure (those who said “I had enough food to eat”) vs the food insecure (those who said they “sometimes” or “frequently” did not have enough to eat.

This is an interesting comparison to make, because there’s some evidence that in the US these two groups don’t always look like what you’d expect. Previous work has found that people who report they are food insecure actually tend to weigh more than those who are food secure. I broke my research down in to three categories:

  1. Confirmation of BMI differences
  2. Comparison of health habits between food secure and food insecure people
  3. Correlation of specific behaviors with BMI within the food insecure group

Here’s what I found:

Confirmation of BMI differences:
Yes, the paradox is true for this data set. Those who were “sometimes” or “frequently” food insecure were almost 2 BMI points heavier than those who were food secure…around 10-15 pounds for most height ranges. Level of food insecurity didn’t seem to matter, and the effect persisted even after controlling for public assistance and income.

Interestingly, my professor asked me if the BMI difference was due more to food insecure people being shorter (indicating a possible nutritional deficiency) or from being heavier, and it turns out it’s both. The food insecure group was about an inch shorter and 8 lbs heavier than the food secure group.

Differences in health behaviors or status:
Given my sample size (over 20,000), most of the questions they asked ended up having statistically significant differences. The ones that seemed to be both practically and statistically significant were:

  1. Health status People who were food insecure were WAY more likely to say they were in poor health. This isn’t terribly surprising since disability would impact people’s assessment of their health status and ability to work/earn a living.
  2. Shopping habits While most people from both groups did their grocery shopping at grocery stores, food insecure people were more likely to use other stores like “supercenters” (i.e. Walmart or Target) and convenience stores or “other” types of stores. Food secure people were more likely to use places like Costco or Sam’s Club. Unsurprisingly, people who were food insecure were much more likely to say they selected their stores based on the prices. My brother had asked specifically up front if “food deserts” were an issue, so I did note that the two groups answered “location” was a factor in their shopping at equal rates.
  3. Soda consumption Food insecure people were much more likely to have drank soda in the last 7 days (50% vs 38%) and much less likely to say it was a diet soda (40% vs 21.5%) than the food secure group.
  4. Exercise Food insecure people were much less likely to have exercised in the last 7 days (50.5%) than food secure people were (63.9%). Given the health status ranking, this doesn’t seem surprising.
  5. Food shopping/preparation Food insecure people were much more likely to be the primary food shopper and preparer. This makes sense when you consider that food insecurity is a self reported metric. If you’re the one looking at the bills, you’re probably more likely to feel insecure than if you’re not. Other researchers have noted that many food stamp recipients will also cut their own intake to make sure their children have enough food.

Yes, I have confidence intervals for all of these, but I’m sparing you.

BMI correlation within the food insecure group:
Taking just the group that said they were food insecure, I then took a look at which factors were most associated with higher BMIs. These were:

  1. Time spent eating Interestingly, increased time spent eating was actually associated with lower BMIs. This may indicate that people who can plan regular meal times might be healthier than those eating while doing other things (the survey asked about both).
  2. Drinking beverages other than water Those who regularly drank beverages other than water were heavier than those who didn’t
  3. Lack of exercise No shock here
  4. Poor health The worse the self assessed health, the higher the BMI. It’s hard to tease out the correlation/causation here. Are people in bad health due to an obesity related illness (like diabetes) or are they obese because they have an issue that makes it hard for them to move (like a back injury)? Regardless, this correlation was QUITE strong: people in “excellent” health had BMIs almost 5 points lower than those in “poor” health.
  5. Being the primary shopper I’m not clear on why this association exists, but primary shoppers were 2 BMI points heavier than those that shared shopping duties.
  6. Public assistance  Those who were food insecure AND received public assistance were heavier than those who were just food insecure.

It should be noted that I did nothing to establish causality here, everything reported is just an association. Additionally, it’s interesting to note a few things that didn’t show up here: fast food consumption, shopping locations and snacking all didn’t make much of a difference.

While none of this is definitive, I thought it was an interesting exploration in to the topic. I have like 30 pages of this stuff, so I can definitely clarify anything I didn’t go in to. Now to put my presentation together and be done with this!

 

Millenials and Communism

I was perusing Twitter this past weekend when I started to see some concerning headlines float by.

Survey: 1 in 2 millennials would rather live in a socialist or communist country than capitalist one

Millenials think socialism would make a great safe space

Nearly 1 In 5 Millennials Consider Joseph Stalin And Kim Jong Un ‘Heroes’

While I could see a survey of young people turning up with the socialism result, that last headline really concerned me. At first I thought it was just a case of “don’t just read the headline“, but all the articles seemed to confirm the initial statistic. AOL said “a lot of them see Joseph Stalin and Kim Jong Un as “heroes.”” Fox News hit on my discomfort when they said “The report also found that one in five Americans in their 20s consider former Soviet dictator Joseph Stalin a hero, despite his genocide of Ukrainians and Orthodox priests. Over a quarter of millennials polled also thought the same for Vladimir Lenin and Kim Jong Un.”

Seriously?

While I know polls frequently grab headlines by playing on people’s political ignorance, this seemed to go a step beyond that. I had trouble wrapping my head around the idea that anyone in the US could list Stalin, Lenin or Jong-Un as a hero, let alone 20-25%. I had to go see what question prompted such an odd set of results.

The overview of the poll results is here, and sure enough, the question that led to the results is worded a little differently than the article. Here’s the screenshot from the report, blue underlines/boxes are mine:

I think the “hero for their country” part is key. That asks people to assess not just their own feelings, but what they know about the feelings of a whole other country.

Interestingly, I decided to look up Kim Jong-un’s in-country approval rating, and some defectors put it as high as 50%.  According to one poll, 38% of Russians consider Josef Stalin to be the “most outstanding person” in world history. You could certainly debate if those polls had problems in wording, sample or other methodology, but the idea that a 25 year old in the US might see a headline like that and conclude that Russians really did like Stalin doesn’t seem outside the realm of possibility. Indeed, further down the report we find out that only 6% of millenials in the US state that they personally have a favorable view of Stalin. That’s lizard people territory folks.

In this case, it appears the polling company was actually pretty responsible about how they reported things, so it’s disappointing that further reports dropped the “in their country” piece. In my ongoing quest to name different biases and weird ways of skewing data, I’m now wondering what to name this one. What do you call it when someone asks a poll question in a way that encompasses a variety of scenarios, then the later reports shorten the question to make it sound like a different question was answered? I’m gonna work on this.

Materialism and Post-Materialism

I got an interesting question from the Assistant Village Idiot recently, pointing me to this blog post1 on materialism and post-materialism in various countries by year, wealth of nation, wealth of individual, age and education level of respondent.  It’s an interesting compilation of graphs and research that seem to show us, as a world, moving from a materialistic mindset, to a post-materialistic mindset. So what does that mean and what’s my take?

First, some definitions.
Up front the definitions are given as follows:

Materialist: mostly concerned with material needs and physical and economic security
Post-materialist: strive for self-actualization, stress the aesthetic and the intellectual, and cherish belonging and esteem

What interested me is that if you go all the way to the end, you find that the question used to categorize people was actually a little more specific.  They asked people the following question:

“If you had to choose among the following things, which are the two that seem most desirable to you?”

  1. Maintaining order in the nation. (Materialist)
  2. Giving the people more say in important political decisions. (Post-materialist)
  3. Fighting rising prices. (Materialist)
  4. Protecting freedom of speech. (Post-materialist)

People then receive a score between 1 and 3.  If you pick both materialist options (#1 and #3), you get a score of 1. If you pick both post-materialist options (#2 and #4), you get a score 3. If you pick one of each, you get a score of 2.

So what are we seeing?

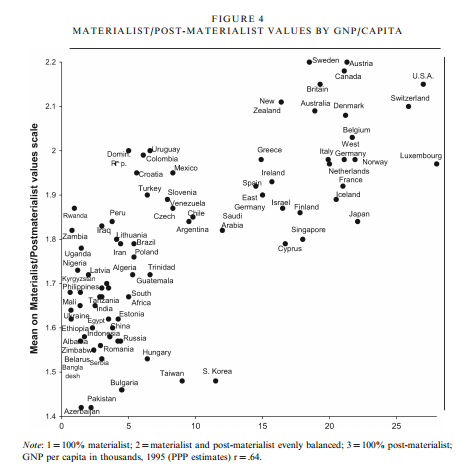
Well, this (from this paper here):

Materialistgraph

Every country in the world scores (on average) between a 1.4 and a 2.2.  There were also graphs that showed that higher class people moved toward post-materialist mindset, and that the world as a whole has been moving towards it over the years.

I do think it’s worth noting that only about 8 countries score over a 2, with a few more on the line. On the whole, more countries skew materialist than post-materialist on this scale…..though the 8 that are higher are all fairly high on the development index.

So what does this mean?

Well, it seems to be a matter of focus. In my opinion, these questions seem to serve as a proxy for current concerns as much as actual preferences. For example, I did not rank “fighting rising prices” very high, but I also live in a country that has only slow inflation for most of my life. Essentially, this appears to be a sort of political Maslow’s hierarchy of needs. It’s most likely not that people don’t care about safety or price stability, but rather they don’t prioritize it if they already have it. Additionally, I would suspect that many people would argue that they like free speech because it maintains order in a country, as opposed to actually desiring free speech over order.

Most of the data comes from one particular researcher, Ronald Inglehart, who focuses on changing values and theorizing what impact that might have on society. Inglehart is not particularly hypothesizing that being post-materialist is bad, but rather that it represents a departure from the way most people have lived for thousands of years.  Because it appears our values slant is set earlier in life, he proposes that those of us growing up in relative safety and security will always bias towards a post-materialist focus. He researches what effect that may have on society.

While some of this may seem obvious, he brings up a couple related outcomes that were fairly subtle. For instance, he points out in this paper that we have seen a reduction in voting stratified by social class, and an increase in voting stratified around social issues.  This suggests that even a very basic level of security like the type provided by our welfare systems allows people more time to focus on their values and ideals.  It varied by country, but in the US there was almost NO difference in materialist/post-materialist values by education class.

This was an interesting point, because I think many people are troubled by how contentious some of our social issue debates have gotten (abortion, women’s rights, the environmental movement, etc) have all gotten. The idea that these issues are now more contentious because more people are devoting more thought to them is intriguing. Additionally, it seems that there would be less national agreement on those types of issues in comparison to safety and security issues. If your country is under attack, there is no debate about defending yourself. We may debate the method, but the outcome is widely agreed upon. With social issues that’s not true. What effect this will have on country level stability is unknown.

Interesting stuff to keep an eye on going forward, and keep in mind this election season.

1. Max Roser (2016) – ‘Materialism and Post-Materialism’. Published online at OurWorldInData.org. Retrieved from: https://ourworldindata.org/materialism-and-post-materialism/ [Online Resource]

Lost in Translation: Survey Edition

I ran across an interesting article from Quartz today that serves as an interesting warning for those attempting to compare cross-cultural survey results.

People from multiple countries were asked the same question “Would you personally accept a refugee into your own home?”, and the results were compared to find the “most welcoming” country.  China came out ahead by a large margin: 46% of residents said yes, as compared to 15% of US residents.

However, when the question was more closely examined, it was discovered that the English word “refugee” does not have an exact translation in Chinese. While in the US “refugee” almost always refers to someone from another country, in Chinese the word has a more neutral “person who has experienced a calamity” definition. Depending on the situation, it is then modified with either “domestic” or “international”.  The survey question did not contain either modifier, so it was up to the respondent’s personal interpretation.

So basically, people in different countries were answering different questions and then the results were compared. Surveys are already prone to lots of bias, and adding inexact translations into the mix can obviously heighten that effect. Interesting thing to be aware of when reading any research that compares international responses.

People: Our Own Worst Enemies (Part 9)

Note: This is part 9 in a series for high school students about reading and interpreting science on the internet. Read the intro and get the index here, or go back to Part 8 here.

Okay, we’re in the home stretch here! In part 8 I talked about how we as individuals work to confuse ourselves when we read and interpret data. Today I’m going to talk about how we as a society collectively work to undermine our own understanding of science, one little step at a time.  Oh that’s right, we’re talking about:

Surveys and Self Reporting

Okay, so what’s the problem here?

The problem is that people are weird. Not any individual really (ed note: this is false, some people really are weird), but collectively we have some issues that add up. Nowhere is this more evident than on surveys. There is something about those things that brings out the worst in us.  For example, in this paper from 2013, researchers found that 59% of men and 67% of women in the National Health and Nutrition Examination Survey (NHANES) database had reported calorie intake that were “physiologically implausible” and “incompatible with life”.  The NHANES database is incredibly widely used for nutrition research for about 40 years, and these findings have caused some to call for an end to self-reporting in nutrition research.  Now I doubt any individual was intending to mislead, but as a group those effects add up.

Nutrition isn’t the only field with a problem though. Any field that studies something where people think they can make themselves look better has an issue. For example, the Bureau of Labor Statistic found that most people exaggerate how many hours they work per week. People who say they work 40 hours normally only work 37. People who say they work 75 hours a week typically work about 50. One or two people exaggerating doesn’t make a difference, but when it’s a whole lot of people it adds up.

So what kinds of things should we be looking out for?

Well, any time things say they’re based on a survey, you may want to get the particulars. Before we even get to some of the reporting bias I mentioned above, we also have to contend with questions that are asked one way and reported another.  For example back in 2012 I wrote about an article that said “1/3rd of women resent their husbands don’t make more money”. When you read the original question, it asked if the “sometimes” resent that their husband doesn’t make more money.  It’s a one word difference, but it changes the whole tone of the question.  Every time you see a headline about what “people think”, be a little skeptical.  Especially if it looks like this:

lizardpeople

That one’s from a survey about conspiracy theories, and they got that 12 million number from extrapolating out the 4% of respondents to the survey who said they believed in lizard people to the entire US population.  In the actual survey, this represented 50 people.  Do you think it’s more plausible that the pollsters found 50 people who believed in lizard people or 50 people who thought this was an amusing thing to say yes to?

But people who troll polls aren’t the only problem, polling companies play this game too, asking questions designed to grab a headline. For example, recently a poll found that 10% of college graduates believe a woman named Judith Sheindlin sits on the Supreme Court.  College graduates were given a list of names and told to pick the one who was a current Supreme Court justice.  So what’s the big deal, other than a wrong answer? Well apparently Judith Sheindlin is the real life name of “Judge Judy” a TV show judge. News outlets had a field day with the “college grads think Judge Judy is on the Supreme Court” headlines. However, the original question never used the phrase “Judge Judy”, only the nearly unrecognizable name “Judith Sheindlin. The Washington Post thankfully called this out, but all the headlines had already been run. Putting in a little known celebrity name in your question then writing a headline with the well known name is beyond obnoxious. It’s a question designed to make people look dumb and make everyone reading feel superior. I mean, quick, who is Caryn Elaine Johnson? Thomas Mapother IV? People taking a quiz will often guess things that sound vaguely right or familiar, and I wouldn’t read too much in to it.

Why do we fall for this stuff?

This one I fully blame on the people reporting things for not giving proper context. This is one area where journalists really don’t seem to be able to help themselves. They want the splashy headline, methodology or accuracy be damned. They’re playing to our worst tendencies and desires….the desire to feel better about yourself. I mean, it’s really just a basic ego boost. If you know that Judge Judy isn’t on the Supreme Court, then you must clearly be smarter than all those people who didn’t right?

So what can we do about it?

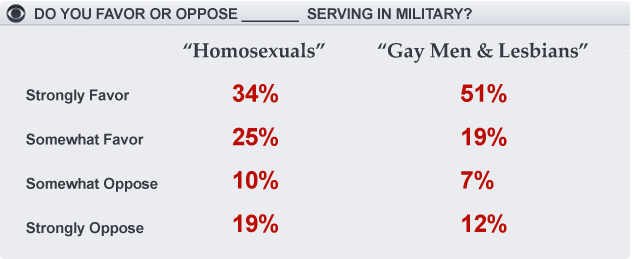
The easiest thing to do is not to trust the journalists. Don’t let someone else tell you what people said, try to find the question itself.  Good surveys will always provide the actual questions that they asked people. Remember that tiny word shifts can change answers enormously.  Words like “sometimes” “maybe” and “occasionally” can be used up front, then dropped later when reported. Even more innocuous word choices can make a difference. For example, in 2010 CBS found that asking if “gays and lesbians” should be able to serve in the military instead of “homosexuals” causes quite the change in people’s opinions:

gaysinmilitary

So watch the questions, watch the wording, watch out for people lying, and watch out for the reporting.  Basically, paranoia is just good sense when lizard people really are out to get you.

See you in Week 10! Read Part 10 here.

Millenials and Parenting

Recently Time Magazine ran an article called “Help! My Parents are Millennials!” that caught my interest.  Since I am both a parent and (possibly) a millennial, I figured I’d take a look to see what exactly they were presuming my child would complain about.

I was particularly interested in how they were defining “millennial”, since Amanda Hess pointed out over a year ago that many articles written about millennials actually end up interviewing Gen Xers and just hoping no one notices. Time’s article started off doing exactly that, but then they quickly clarified that they define “millennial” as those born from the late 70s to the late 90s.  This is actually about a seven year shift from what most other groups consider millennials, with the most commonly cited years of birth being 1982 to 2004 or so. Interestingly, only Baby Boomers get their own official generational definition1 endorsed by the Census Bureau: birth years 1946 to 1964.

I bring all this up, because the Time article include some really interesting polling data that purports to show parental attitude differences. Those results are here. Now it looks like they polled 2,000 parents, representing 3 generations with kids under 18.  I DESPERATELY want to know what the number of respondents for each group was. See, if you do the math with the years I gave above, the only Boomers who still have kids under the age of 18 are those who had them after the age of 33….and that’s for the very youngest year of Boomers. While of course it’s not impossible to have or adopt children over that age, it does mean the available pool of Boomers that meet the criteria is going to be smaller and skewed toward those who had children later. Additionally, if you look at the Gen X range, you realize that Time cut this down to just 10 years because of how early they started the Millennials. I don’t know for sure, but I’d guess the 2,000 was heavily skewed towards Millennials.  Of course, since we couldn’t even get numbers, we can’t possibly know which of the attitude differences they looked at were statistically significant. This annoys me, but is pretty common.

What irritated me the most though, is the idea that you can really compare parenting attitudes for parents who are in entirely different phases of parenting.  For example, there was a large discrepancy in Millennial vs Boomer parents who worried that other people judge what their kids eat. Well, yeah. Millennials are parenting small children right now, and people do judge parents more for what a 5 year old eats than a 16 year old.

Additionally, there were some other oddities in the reporting that made me think the questions were either asked differently than reported, the respondents were unclear on what they should answer, or the sample size was small.  For example, equal numbers of Boomers and Millennials said they were stay-at-home parents, which made me wonder how the question was phrased. Are 22% of Boomers still really staying home with their teenagers? My guess is some of them answered what they had done.  Another oddity was the number who said they’d never shared a picture of their child on social media. I would have been more interested in the results if they’d sorted this out by those who actually had a social media account. I also am thinking this phrasing could be deceptive. I know a few Boomers who would probably say they don’t share pictures of their kids, but will post family photos. YMMV.

Anyway, I think it’s always good to keep in mind how exactly generations are being defined, and what the implications of these definitions are. Attitude surveys among generations will always be tough to do in real time, as much of what you’ll end up testing is really just some variation of “people in their 50s think differently from those in their 20s”.

1. Typical

Workin’ for the Man

I’m headed back to work today.  It’s a bit early, but in exchange I get to work part time through Thanksgiving.

Given that, I thought this headline made for a good blog post today: “Is Opting Out the New American Dream for Working Women?“.  In a survey by ForbesWomen and TheBump.com, they found that:

84% of working women told ForbesWoman and TheBump that staying home to raise children is a financial luxury they aspire to.What’s more, more than one in three resent their partner for not earning enough to make that dream a reality.

Yikes.

Subsequently I saw several bloggers reference the fact that “84% of women want to be stay at home moms”, so I decided to do a little digging.  What did this survey really say?  Well, Forbes published more about the survey here.

Weirdly, in that recap, the only time the 84% number is mentioned is in reference to women believing staying at home is a financial luxury, leading me to be more than a little curious as to how they phrased the question.  Do 84% of women actively want to stay at home, or do 84% of women wish they had enough money that they got to make the choice?  This quote from the article lead me to believe perhaps we were really discussing something rather than prioritizing staying at home with the kids:

As one (working) mom of two told me, she may dream of leaving work to take care of her kids, but the (financial) reality of it is not so ideal. “Sure, if my husband made so much money that I could spend time with the kids, still afford great vacations and maybe the occasional baby sitter to take a class or go out with friends, I’d be the first to sign up,” she said. “So maybe while it’s a luxury I do think about, it’s not one I would want unless it was actually luxurious. I don’t want to be a stay at home mom who clips coupons or plans her weekly menu to make ends meet… If that’s the case, I’d gladly go on working to avoid that fate.”

So it sounds like at least some of the respondents were focused less on wanting to opt out of the workplace to raise their kids, and more on wanting to have enough money to keep their standard of living while not feeling pressured to work.  Two slightly but significantly different things IMHO.  I have rarely seen a stay at home mom who didn’t strive to make the household more financially efficient while at home, so this dream seemed a bit divorced from reality. This is backed up by the survey’s additional result that only half of working women think they’d be happier if they stayed home.  I’d also guess most of us would be happier if we had enough money to completely call the shots regarding where we worked.

Of course none of this addresses the totally skewed sample that comes from two websites joining up to do a survey like this.  Doubtless ForbesWomen/TheBump do not attract a random crowd.  Additionally, it should be concerning to our sense of family that 1/3 of women are resenting their husbands for not making more money….though to note the survey used the phrase “sometimes resent” while the article merely used “resent”.

A side note about this survey….one of the last questions was about how much women spent on themselves per month.  Most (63% of working moms, 78% of stay at home mom’s) said they spent less than $100 a month on themselves.  Every time I see a question like this, I always wonder where people count cable TV and haircuts.  When I was getting my degree, they mentioned that during premarital counseling you should always ask the woman how much she thought a reasonable haircut cost.  Apparently that one expenditure can cause a lot of fights.  I definitely know women who believe a basic haircut costs $80 or more.

All that being said, I’m going to miss my little monkey today, but I’m happy to have a job I love to go back to, I don’t resent my husband, and I think a reasonable haircut for a woman costs $40.

Kids these days

There’s a certain brand of newspaper headline that used to really annoy me when I was a teenager.  At the time I dubbed them “kids these days” headlines….essentially headlines that play to older people’s love of fretting over how bad things are in the younger generation.  Prime examples are pretty much on repeat: they’re lazy, they’re not getting the education the older generation got, they’re irresponsible, they’re selfish, they like bad music.

I’m over a decade removed from teenagerhood, but my gosh do I still hate those headlines.   I am pretty much of the opinion that every generation has their own pluses and minuses, and we all need to chill out.  Headlines that say “hey, this new generation really figured out a bunch of stuff our target demographic totally screwed up” are just not going to sell.  
ANYWAY, I saw a good example of this in USA Today (via Instapundit)  with the headline “Younger people expect inheritance that won’t exist”.  
Oh those darn kids!  Always expecting their parents to support them.  Entitled whipersnappers!

First off, this was based on a study done by TD Ameritrade.  For all the issues I have with academic studies, studies done by companies trying to sell you something are even worse.  Also, they almost never release their source data.  
You don’t have to look far to see where this one got ridiculous:

Nearly 40% of Generation Z, those ages 13 to 22, expect to receive an inheritance, according to a recent TD Ameritrade study. As a result, they don’t believe that they will need to save for retirement.

Seriously? They asked 13 to 22 year olds about their retirement saving ideas and then report that their expectations are unrealistic?  I would be more weirded out if the study had shown that 40% of them had a comprehensive plan in place.  Most 13 to 22 year olds haven’t entered the full time workforce yet.

I mean, my retirement accounts are doing fairly well thank you very much, but I opened the first one when I was exactly 22….you know, after I got my first post college full time job.  Coincidentally, that was also the first time I gave any serious thought to the entire concept of retirement.

They don’t provide any information about the age distribution of the respondents, but if it was even, 40% of kids in a group of that age range would be 13 to 16.  I’ve never parented a teenager, but it strikes me that most parents of kids in that age range probably aren’t having in depth discussions with them about their financial situation, and certainly not about their retirement savings.  Even those who are teaching financial lessons to their kids probably limit their disclosure about specific numbers.  Asking kids in that age range to have an educated opinion about this is ridiculous.

One more thing….I don’t know what kids they polled for this study.  However, the chances that an investment firm polled children of it’s own clients is pretty high.  Parents who have investment firm accounts are probably more likely to actually be leaving their kids an inheritance, correct?  It’s suspicious to me that they go from their own specific study to a “in general parents aren’t leaving their kids money”.  How about the kids of these parents?

Alright, that’s all I can say without seeing how this study was actually done.  Now get off my lawn.

More census data….the minority-majority issue

I was happy to see that my post from yesterday  got an excellent comment from Glenn, a former Census Bureau employee.  He let me know that it was likely the sample they used was actually a stratified cluster sample, which is not exactly what I had surmised, but close.

As I was looking up more info on some of the Census Bureau data, I ran in to a fascinating column from Matthew Yglesias over at Slate.com.  In it, he describes his experience filling out the census form, and how his own experience made him question some of the data being released.

In specific, he questioned the recent headline that we are quickly heading towards a minority-majority society.  He mentions that as a 25% Cuban man, he looks very white, but was not sure how to answer the question regarding whether he was “Hispanic in origin”.  If he wasn’t sure how to answer a race question, how many others were in his boat?  He further comments that as people continue to become increasingly of mixed racial background (keeping in mind that 1 out of 12 marriages is now mixed race) it is much more likely that we will have to shift our concept of what “white” is to keep up with the times.

As Elizabeth Warren can tell you, percentage of heritage matters….but where do we draw the line?  If 3% Native American isn’t enough, how much is?  I mean that quite literally.  I don’t know.

In my cultural competency class in school, we had a fascinating example of racial confusion.  One of the girls I sat next too mentioned that her grandparents were from Lebanon, had immigrated to South America, her parents were both born there, married, moved to the US, and that’s where she was born.  Her skin was fair, she was fluent in Spanish, and she felt she spent her life explaining that she was genetically Arabic, ethnically South American and culturally American.  I don’t know what she checked off on the census, but I’m sure nothing captured that particular combination accurately.

As times change, so do our ideas of race. When reading the history of census racial classification, it’s hard to disagree with Yglesias’ assertion that today’s racial breakdown will not be comparable to whatever breakdown we have in ten years.  That’s a good thing to keep in mind when analyzing racial data.

 Racial numbers are as good as the categories we have to put them in.   

The (ACS) Devil and Daniel Webster

As a New Hampshire native, I am prone to liking people named Daniel Webster.

It is thus with some interest that I realized that the Florida Congressman who is sponsoring the bill to eliminate the American Community Survey happens to share a name with the famous NH statesman.  I have been following this situation since I read about it on the pretty cool Civil Statistician blog, run by a guy who runs stats for the census bureau.

Clearly there’s some interesting debate going on here about data, analysis, role of the government, and the classic “good of the community vs personal liberty” debate.

I’m going to skip over most of that.

So why then, do I bring up Daniel Webster?

Well, I was intrigued by this comment from him , as reported in the NYT article on the ACS:

“We’re spending $70 per person to fill this out. That’s just not cost effective,” he continued, “especially since in the end this is not a scientific survey. It’s a random survey.”

It was that last part of the sentence that caught my eye.

I was curious, first of all, what the background was of someone making that claim.  I took a look at his website, and was pleased to discover that Rep. Webster is an engineer.   It’s always interesting to see one of my own take something like this on (especially since Congress only has 6 of his kind!).

That being said, is a random survey unscientific?

Well, maybe.

In grad school, we actually had to take a whole class on surveys/testing/evaluations, and the number one principal for polling methods is that there is no one size fits all.  The most scientifically accurate way to survey a group is based on the group you’re trying to capture.  All survey methods have pitfalls.   One very interesting example our professor gave us was the students who tried to capture a sample of their college by surveying the first 100 students to walk by them in the campus center.  What they hadn’t realized was that a freshman seminar was just letting out, so their “random” survey turned out to be 85% freshman.  So over all, it’s probably worse when your polling methodology isn’t random than when it is.

There’s all kinds of polling methods that have been created to account for these issues:

  • simple random sampling – attempts to be totally random
  • systematic sampling – picking say, every 5th item on a list
  • stratified sampling – dividing population in to groups and then picking a certain percentage from each one (above this would have meant picking 25 random people from each class year)
  • convenience sampling – grabbing whoever is closest
  • snowball sampling – allowing sampled parties to refer/lead to other samples
  • cluster sampling – taking one cluster of participants (one city, one classroom, etc) and presuming that’s representative of the whole
There are others, though most subtypes off of these types (see more here).
So what does the ACS use?  
As best I can tell, they use stratified sampling.  They compile as comprehensive a list as they can, then they assign geocodes, and select from there.  So technically, their sampling is both random and non-random.   

Now, NYT analysis aside, I wonder if this is really what Webster was questioning.  The other meaning one could take from his statement is that he was challenging the lack of scientific method.  As an engineer, he would be more familiar with this than with sampling statistics (presuming his coursework looked like mine).  What would a scientific survey look like there?  Well, here’s the scientific method in a flowchart (via Sciencebuddies.org):

So it seems plausible he was actually criticizing the polling being done, not the specific polling methodology.  It’s an important distinction, as all data must be analyzed on two levels: integrity of data, and integrity of concept.   When discussing “randomness” in surveys, we must remember to acknowledge that there are two different levels going on, and criticisms can potentially have dual meanings.