Okay, so we started off our discussion of Statistical Tricks and Treats with a general post about contingency matrices and the two ways to be wrong, and then followed up with a further look at how the base rate involved in the matrix can skew your perception of what a positive or negative test means.
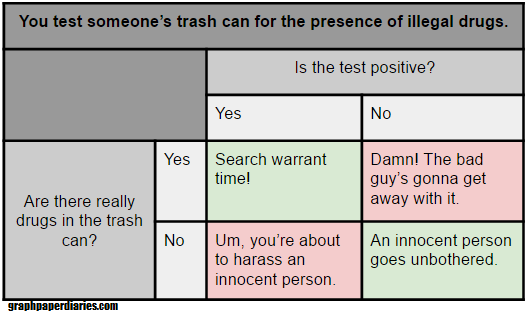
In this post I’m going to take another look at the contingency matrix and define a few words you may hear associated with them. But first, let’s take another look at that matrix from last week:
Accuracy: Accuracy is the overall chance that your test is correct in either direction. So we’d have this:
Number of correct search warrants + number of innocent people left alone
Total number of tests run
Note: this SHOULD be the definition used. People will often try to wiggle out of this by saying “it’s accurate 99% of the time when drugs are present!”. They are hoping the word “accurate” distracts you from their failure to mention what happens when drugs aren’t present. This is the type of sales pitch that leads to innocent people getting arrested and cops who had no idea the were using a test that likely to be wrong.
Sensitivity: When that hypothetical sales person up there said “it’s accurate 99% of the time when drugs are present!”, what they were actually giving you was the sensitivity of the test. It (along with specificity) answers the question “How often does the test do what we want it to do?” The sensitivity is also called the true positive rate, and it’s basically this:
Correct warrants/arrests
Correct warrants/arrests + bad guys who got away with it
In other words, it’s the number of “correct” positives divided by the total number of positives. Another way of looking at it is it’s the number in the top row green box over the total number in the top row. A high percentage here means you’ve minimized false negatives.
Specificity: This is the opposite of sensitivity, and in this example it’s the one the sales person is trying not to mention. This is how accurate the test is when drugs are NOT present, aka the true negative rate. It looks like this:
Number of times you left an innocent person alone
Harassed and harassed innocent people whose trash was tested
Basically it’s the number of correctly negative tests divided by the number of total negative tests. It’s also the number in the green box in the bottom row over the total number in the bottom row. A high percentage here means you’ve minimized false positives.
Positive Predictive Value: Okay, so both sensitivity and specificity dealt with rows, and this one deals with columns. Positive predictive value is a lot of what I talked about in my base rate post: if you get a positive test, what are the chances that it’s correct?
As we covered last week, it’s this:
Correct search warrants/arrests
Correction search warrants/arrests + incorrect warrants/arrests
In other words, given that we think we’ve found drugs, what are the chances that we actually have? It’s the green box in the first column over the total number in the first column. This is the one the base rate can mess with BIG time. You see, when companies that develop tests put them on the market, they can’t know what type of population you’re going to use them on. This value is unknown until you start to use it. A high value here means you’ve minimized false positives.
Negative Predictive Value: The flip side of the positive predictive value, this is about the second column. Given that we got a negative test, what are the chances there are no drugs? This is:
Innocent people who go unbothered
Innocent people who go unbothered + bad guys who get away with it
So for the second column, the number in the green box over the total second column. A high value here means you’ve minimized false negatives.
So to recap:
Sensitivity and Specificity:
- Answer the question “how does the test perform when drug are/are not present”
- Refer to the rows (at least in this table set up)
- High sensitivity = low false negatives, low sensitivity = lots of false negatives
- High specificity = low false positives, low specificity = lots of false positives
- Information about how “accurate” one of the values is does not give the whole picture
Positive and Negative Predictive value (PPV and NPV):
- Answer the question “Given a positive/negative test result, what are the chances drugs are/are not actually present?”
- Refer to columns (at least in this table set up)
- High PPV = low false positives, low PPV = high false positives
- High NPV = low false negatives, low NPV = high false negatives
- Can be heavily influenced by the rate of the underlying condition (in this case drug use) in the population being tested (base rate)
