Man, that title probably isn’t winning me any clickbait awards.
Anyway, I was catching up on my blog reading this past weekend, and I was intrigued by the Assistant Village Idiot’s “Conservation of Fear” post. In it, he mentions the idea that most of us probably have some sort of baseline disposition towards the world, and that circumstances aren’t always as important as we think they are. We frequently assume that as good things increase so does our mood, and as bad things increase our mood goes lower, but he asserts this may not always be the case. Of course this being the AVI, he immediately then walks back on that assertion and points out that some circumstances are really important, and that fixing those can make a big difference in mood. So basically as some good circumstances increase we could get a nice linear gain in happiness, but at a certain point the relationship probably cuts out.
This uneven effect issue is not actually all that uncommon in human behavior. While generally people want to find (or recite) nice linear relationships between things (ie x causes y), we often run in to situations where things aren’t that simple. Sometimes x makes y go up….but then you get to a certain level of x and suddenly x is totally irrelevant to y. Sometimes above a certain level x makes y go down. You get the picture. Or maybe you don’t. Regardless, here are some examples!
- Income and Personal Happiness We all know the famous saying “money can’t buy happiness”. However, as anyone who has ever gone without money can tell you, that’s crap. Well, partial crap. A few years ago an investment group did some analysis and figured out that more money does make you happier, but only up to a certain household income. After that, it’s pretty much a wash. Overall for the US the cutoff was $75K. Basically an increase in salary from $30K to $40K will make you happier, but one from $110K to $120K doesn’t have the same effect. The linear relationship occurs for low numbers, but not high ones. For the curious, here’s the state to state breakdown:
 If you think about it, this makes a lot of sense. If money is a struggle, it affects your happiness. Once you’ve stopped struggling, it stops having the same effect. So basically it’s more accurate to say that money can’t buy happiness, but a lack of money sure can stress you out.
 - GDP and Subjective Well Being Related to #1, but slightly different: it’s not just your personal income that helps your well being, your country’s GDP can play a role too. Again though, only to a point. Check out this graph from Our World in Data:
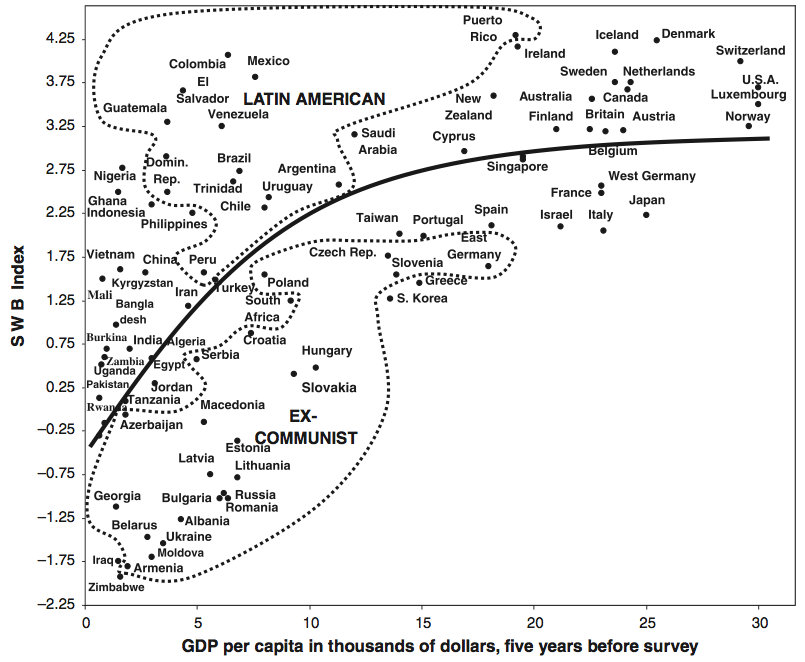 So countries that struggle to develop do take their toll on their citizens, but at some point development stops yielding returns in well being. It would be interesting to see if the effect of personal wealth varied with country GDP, but alas I can’t find that data.
 - Sexual frequency and housework divisions If my ranting about linear relationships that aren’t entirely linear sound familiar, it’s because I’ve brought this up before in my (oft Googled, less often read) Sex, Models and Housework post and the follow up. My first post was about a study that caused a stir when it claimed that men who did more housework had less sex. The follow up covered a study that rejected a linear model, and instead grouped respondents in to “traditional”, “egalitarian” and “counter-cultural” couples. Despite the claims of the original study, they found that the relationships were only really linear within the groups, but that it was 3 different linear relationships. Egalitarian couples had the most sex and satisfaction, traditional couples had slightly less, and counter-cultural couples did the worst. The model worked much better when the three groups were treated separately than when they were treated as a continuous group.
- Age at first marriage The conventional wisdom states that waiting a bit to get married is good for you. It turns out that’s true, until a point. For each year you wait to get married past the age of 20, your chance of divorce goes down 11%. However, once you get to 32, your chance of divorce actually starts going back up. Basically the divorce risk curve is now a parabola:

- Expenses and income I found a couple examples of this in this technical paper for statisticians on how to handle partially linear logistic regressions. Basically, the consumption of many household items goes up with household income until a certain point where it stays pretty steady. Things like gas, electricity, and many consumer goods fall in this category. Interestingly, overall income and expenses actually increase sort of linearly with age from 20-44, then decrease sort of linearly with age from 45-75+:

This is a good thing to watch out for in general, as it makes summarizing the trends a little trickier. If you leave out a key modifier or the limits, you could end up giving someone a wrong impression or encouraging people to extrapolate beyond the scope of the model, and that will make the statistician in your life very sad. Know your limits people, and the limits of your data set!

I got married the first time at 35. She died. Remarried 10 years later, and still going.
LikeLike
Well it sounds like it’s been awhile, but I’m still sorry for your loss.
Interesting to note, the trend I mentioned is actually fairly new. The data from 1995 didn’t show this curve:

And of course there’s no label on the x-axis, but the divorce rate still isn’t over 50%.
LikeLike