Of all the strange things about statistics education in the US (and other countries for all I know) is the way we teach kids about the bimodal distribution. A bimodal distribution is a set of data that has two peaks (modes) that are at least as far apart as the sum of the standard deviations. It looks like this:
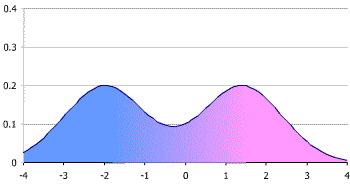
It’s an important distribution to know about, because if your data looks like this, your calculations for the average are going to be totally useless. For the distribution above for example, we’d get an average of (around) zero, which would tell us nearly nothing about the data itself, and would completely miss both peaks. So far so good. However, when this is taught in stats classes, the “real world” example most kids are given is human height….and human height is not bimodal. Bummer.
Given that it’s the start of the school year and all, I thought it would be a good time to provide teachers with some new examples. Now, depending on the underlying data set you might use, some of these examples may not make the “peaks separated by the length of the combined standard deviations” cutoff either…..but at least you’ll be wrong in new ways. That’s got to count for something, right?
- Starting salaries for lawyers On average new lawyers do well. In reality there are big winners and losers in the whole “getting a good job after graduation” game, and it shows in the salary distributions. Read the Above The Law complaint here.
- Book prices Book prices cluster around different price points, depending on whether your looking at paperbacks or hardcovers as God Plays Dice explains. If the gap between paperback and hardcovers isn’t wide enough for you, imagine you could pull price data for every book available on Amazon.com. You’d end up with a two modes, one for regular books and one for textbooks.
- Peak restaurant hours If you plotted a histogram of when every customer entered a restaurant on a given day, you’d end up with a bimodal distribution around 2 points: lunch and dinner. This type of histogram also tends to appear when you map road usage (morning and afternoon rush hours) and residential water/electricity usage (before and after work).
- Speed limits This one I actually couldn’t find much data on, but I’m guessing if you mapped out all the speed limits on every mile of road in the US (or maybe just your state), your distribution would end up clustered around 30/35 and then again around 60/65. Basically highways or regular roads. This distribution would also have the additional wrinkle of skewing differently based on whether we used miles of road or number of roads, but that’s a different matter entirely.
- Disease patterns There’s a rather fascinating two part blog post by Jules J Berman that discusses bimodal cancer patters here and here. Basically these are cancers that appear similar but tend to hit rather different ages groups. For example Karposi’s sarcoma hits young men with AIDS and older men who do not have AIDS, and Berman argues that seeing these patterns should give us important clues about the diseases themselves. Possible explanations from Berman’s post: 1. Multiple environmental causes targeting different ages 2. Multiple genetic causes with different latencies 3. Multiple diseases classified under one name 4. Faulty or insufficient data 5. Combinations of 1,2,3 and 4.
Bimodal distributions are also a great reason why the number one rule of data analysis is to ALWAYS take a quick look at a graph of your data before you do anything. As you can see from the above examples, the peaks almost always contain their own important sets of information, and must be understood both separately and together in order be understood at all.
So what’s your favorite non-human height example?

Not an answer, but you’ve seen http://xkcd.com/1725/ , correct?
Sometimes you can get distributions that look muddy in the usual variables, but with the right combinations of variables separate much more nicely. Enter neural nets, stage left…
There’s this one used for particle identification: the bright green or red bands represent different particle types. You can see that when the momentum is high enough the speeds of different particles become indistinguishable from the speed of light, but at low momentum an electron has to be moving much faster than a pion to carry the same momentum.
LikeLike