I wasn’t intending to write about student debt this week, but oddly enough I had two different people ask me about it on the same day. The first was a younger coworker, who had heard Elizabeth Warren say that student loan debt disproportionately affected African Americans and was curious if that was true. He also wanted to where “average student loan debt” numbers came from. The second was the AVIs wife, who sent me a new report looking at the return on investment from different types of colleges, and wanted to know if family income was taken in to account.
Okay, so let’s take this one thing at a time. First, Warren’s comments came from a Tweet where she also shared this article. For clarity, I want to note that this article ISN’T by Warren, but her Tweet would seem to indicate some agreement. The article started with the stat that the average student loan debt was $37,102. My colleague (a fairly recent grad) thought that sounded low.
The average student loan debt number comes from this Chamber of Commerce report. Now this report was interesting because it is looking only at those people who graduated in 2017. When my colleague had first mentioned this to me, I had wondered if the “average” number was including those further from graduation, but it doesn’t. It did however, point out that student loan debt varies wildly based on the region of the country you live in:

New England is one of the highest average levels, so those of us living here will tend to see higher loan totals among our peers. Additionally, borrowers owing 6 figures are the fastest growing group of borrowers, with about 2 million people owing over $100,000. While much of that is due to graduate school debt, one would suspect those folks would be concentrated in the same areas as the higher levels of debt.
So what about the disproportionate impact claim? Well, that also came from the Chamber of Commerce report. More black students take out loans to pay for their education (77% vs a national average of 60%), they take out higher amounts ($29,000 vs $25,000) and are more likely to default on their loans within 12 years of graduation (50% vs 36% of Hispanic students and 21% of white students). However, it’s important to note that this is comparing graduating students to other graduating students….it excludes those who didn’t go to college or didn’t graduate. Those groups are also disproportionately comprised of minorities. Inside Higher Ed has a good graph of the outcomes by race 6 years after people matriculate:
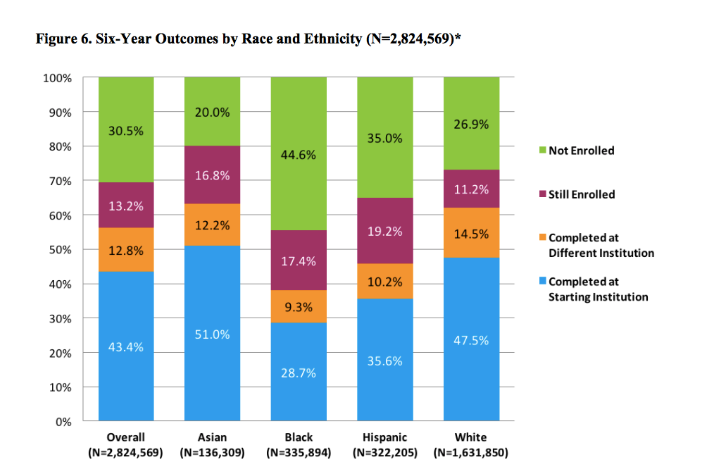
I think this is striking because it’s something I always wonder about when we talk about student loan forgiveness. Some people choose not to go to college or start in community colleges because of the expense of college. Forgiveness of debt may really help some people, but in many cases big choices have already been made. If there is inequality in those initial choices, then loan forgiveness will not solve those inequalities. We know that white 18 to 24 year olds are more likely to enroll in college than black or Hispanic students, so while the loans taken out by black students may be higher, the proportion of people taking them out is lower. It may still be true, but I think it should be clearer that we’re only talking about students here.
I think this is an important point because if we’re talking fairness, then we have to consider the poorest among us may be among the least likely to take out student loans to begin with. Indeed, an analysis of Warren’s plan showed only 10% of the benefits of this plan would go to the bottom 20% of households. By contrast, the top 20% of qualifying households would get 18% of the benefits. This may even out as the other parts of her plan were implemented (reduction in college cost going forward), but it’s something to consider. (Note: I will fully admit I haven’t spent much time studying Warren’s proposal, so I may be missing something. Let me know in the comments if I’ve misstated something and I’ll update. I’m using her plan as an example to discuss the broader point about who currently carries student loan debt, not to knock her proposal over others. I really appreciate that she was willing to publicly release her plan for discussion like this.)
Alright so now to the last point….what’s the return on investment for college students? Well according to this calculation in the short run (10 years) it’s better to have gone to a public school than a private one, but by the 40 year mark it’s better to have gone to a private school. For example, my alma mater is Boston University. At the 10 year mark, it’s the 3,318th best ROI in the country. By year 20 post grad, it jumps to 464. By year 30, it’s at 142, and by 40 years it’s almost one of the top 100 best values at 116. The calculator is fun to play around with because you note some interesting patterns. Small schools in the Boston area do better than small schools in New Hampshire, which I will guarantee is a function of the graduates staying near cities. There’s no cost of living adjustment in alumni salary calculations. Some of the Protestant colleges my friends and family went to don’t fare well, but I’d suspect an inordinate number of graduates go in to things like social work, teaching or other ministry positions. In fact a good number of the “worst” ROI schools are actually Rabbincal colleges.
So are these institutions cherry picking rich students and then taking credit for their earnings? Possibly. Nothing in the calculations takes your family’s wealth in to consideration, so a kid who inherits the family business gets counted the same way as a kid who comes from nothing. Additionally, it’s interesting to note that some specialty schools do really well (pharmacy) and some really poorly (art). Schools who don’t have a lot of different types of graduates are very tied to how the professions associated with them are doing.
Additionally, families with money probably tend to send their kids to private schools to begin with. For example, Stephanie and Shane McMahon (children of Vince and Linda McMahon, owners of the WWE) both went to Boston University and then promptly went to work for the family business. I don’t know for sure, but I suspect they never looked at UCONN when they were applying. Now this wasn’t every kid at BU, but having even a handful of the already wealthy can be enough to boost your lifetime earnings scores. In other words, we don’t know if BU is a better deal for a kid from a middle class household who wants to be a high school teacher, or if UMASS would be equal in those circumstances. We only know that overall, BU grads do better 40 years out.
So overall we don’t really know what we don’t know here, but we do know that many college stats leave out some confounders (who didn’t go to college, who was going to have money handed to them regardless of college status). Overall I think they are good for getting a general sense of things, but up close they have some issues. Like a Monet painting or something.

It also doesn’t give a really good handle on how much value-added a school gives relative to the qualifications of the students they accept. I recall some studies measure waiting-list kids versus kids that attended private colleges and didn’t see much difference.
Of course, that may just be confirmation bias on my part
LikeLike
I remember a similar study, though I believe the one I’m thinking of compared those who got in but declined for various reasons (better financial aid elsewhere, closer to home, etc) and those who got in and attended. I’ll have to poke around and see if I can find it.
LikeLike
I have several thoughts. First, New England does not invest in public universities the way other area of the country do. The public schools of the Big Ten, Pac Ten, SEC and Big 12 are each of much higher quality than any public university in NE. New Englanders, per force, must attend private schools for a good education. You went to BU; I went to NU up the road. As Gov. Peabody famously said, “UMass is for kids who can’t get into college.
Second, didn’t the Federal Government take over the student load program a few years ago? Aren’t most student loans from Sallie Mae? Aren’t the problems with student loans, disparate impact, the Feds’ doing?
Third, go over to iSteve on the Unz Review. He lists the top 50 schools for median income some 10 years out. Most of the top schools are either pharmacy (six year programs) or merchant marine. The list is actually quite surprising. Ten years out does not answer your point about long term, but a review of the 10-year list is well worth your effort. And enlightening.
Fourth, get out of NE. The public schools and colleges suck. The weather sucks, The politics suck. And the cost of living is way too high. I suggest north central rural Ohio. It’s not being colonized by Massholes or Californicators.
LikeLike
The report I mentioned has both 10 years out and 40 (and 20, and 30), and they all show slightly different biases. Not sure if they came up with the same list as iSteve, I might poke around when I have more time.
Interesting points about New England schools and the federal government owning the loans. From what I saw, yes, the vast majority of loans are from the federal government, which is why they have such clear data.
I have no idea what you’re talking about with New England weather. Why today it was 38 degrees and raining, what more could you ask for? I kid of course. Unfortunately no area of the country offers proximity to family like New England does, and that more than makes up for many faults.
LikeLike