So my regular mortality data posting is going to be delayed, as unfortunately we’ve had two pretty close to home deaths within 10 days of each other. Neither were COVID related, but some deaths just make you feel like a light has gone out in the world. Both of these deaths were of that sort, and it’s going to be a dimmer Christmas without them.
Having lost two family members back to back, I’ve gotten the question a few times “was this expected?”. For one it certainly was, for the other not as much. But given that my stress response is often to look at numbers, I did get curious what the probability we were working with was at baseline.
I had posted the Social Security Administrations Actuarial table in one of my posts, so I turned there first. This pleasant little table is broken down by male/female and for each year of life gives you the chance you’ll die in the next year, the number of people (out of 100k) in your age cohort who are still alive, and the number of years you likely have left. All the data is for 2019, so COVID is not included here.
Graphing the probability of death in the next year, it looks like this:
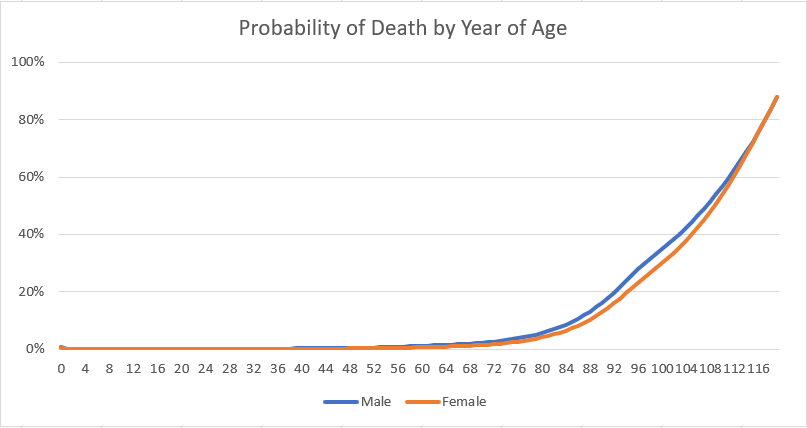
Those seem like decent odds, especially since it’s not random. It is very likely that some chunk of the people in your age category who will die before their next birthday already know, or at least have some serious hints. Terminal cancer diagnoses, major medical events, etc, tend to give a little warning.
Do you want to get even more morbid while we learn about the power of compounding percentages? Good! Here’s the graph of how the death patterns will likely go for 100k people born the same year as you:

So if you are a man born in a particular year, you won’t lose your first 10k cohort members until you’re about 55. In the next decade by age 65, you’ll lose another 10k. The next 10k only take until 72, then 77, 81, 84, 87, 90, and at 94 there will be less than 10k left. For women those numbers are….why don’t I just put this in a table:
| # of birth year cohort remaining (of each 100k) | Male – age | Female – age |
|---|---|---|
| 90k | 55 | 63 |
| 80k | 65 | 73 |
| 70k | 72 | 78 |
| 60k | 77 | 82 |
| 50k | 81 | 85 |
| 40k | 84 | 88 |
| 30k | 87 | 91 |
| 20k | 90 | 93 |
| <10k | 94 | 96 |
It’s interesting that the male/female difference appears to come primarily from young age deaths – things actually even out quite a bit as they get older.
I apologize I don’t have a happier/more interesting post. If it helps, you can read about the practice of meditating on your death to help you focus on what’s important: Memento Mori.
I’ll get back on my regular schedule some time in the new year. Stay safe everyone.

Freshman orientation at William & Mary they used to try and scare us in the old days. “Look to your left. Look to your right. At graduation in four years, only one of you will be here.” My friend Sam (who went on to have a building there named after him) was sitting on the aisle and turned to his roommate on the other side. “We’re in luck, John. One of ’ems gone already!”
LikeLike