Women, Ovulation and Voting in 2016

Welcome to “From the Archives” where I revisit old posts  to see where the science (or my thinking) has gone since I put them up originally.

Back in good old October of 2012, it was an election year and I was getting irritated1. First, I was being bombarded with Elizabeth Warren vs Scott Brown for Senate ads, and then I was confronted with this study:The fluctuating female vote: politics, religion, and the ovulatory cycle (Durante, et al), which purported to show that women’s political and religious beliefs varied wildly around their monthly cycle, but in different ways if they were married or single. For single women they claimed that being fertile caused them to get more liberal and less religious, because they had more liberal attitudes toward sex. For married women, being fertile made them more conservative and religious so they could compensate for their urge to cheat.  The swing was wide too: about 20%.  Of note, the study never actually observed any women changing their vote, but compared two groups of women to find the differences. The study got a lot of attention because CNN initially put it up, then took it back down when people complained.  I wrote two posts about this, one irritated and ranty, and one pointing to some more technical issues I had.

With a new election coming around, I was thinking about this paper and wanted to take a look at where it had gone since then. I knew that Andrew Gelman had ultimately taken shots at the study for reporting an implausibly large effect2 and potentially collecting lots of data/comparisons and only publishing some of them, so I was curious how this study had subsequently fared.

Well, there are updates!  First, in 2014, a different group tried to replicate their results in a paper called  Women Can Keep the Vote: No Evidence That Hormonal Changes During the Menstrual Cycle Impact Political and Religious Beliefs by Harris and Mickes.  This paper recruited a different group, but essentially recreated much of the analysis of the original paper with one major addition. They conducted their survey prior to the 2012 election AND after, to see predicted voting behavior vs actual voting behavior.  A few findings:

  1. The first paper (Durante et al) had found that fiscal policy beliefs didn’t change for women, but social policy beliefs did change around ovulation. The second paper (Harris and Mickes) failed to replicate this finding, and also failed to detect any change in religious beliefs.
  2. In the second paper, married women had a different stated preference for Obama (high when low feritility, lower when high fertility), but that difference went away when you looked at how they actually voted. For single women, it was actually the opposite. They reported the same preference level for Obama regardless of fertility, but voted differently based on the time of the month.
  3. The original Durante study had taken some heat for how they assessed fertility level in their work. There were concerns that self reported fertility level was so likely to be inaccurate that it would render any conclusions void. I was interested to see that Harris and Mickes clarified that the Durante paper actually didn’t accurately describe how they did fertility assessments in the original paper, and that they had both ultimately used the same method. This was supposed to be in the supplementary material, but I couldn’t find a copy of that free online. It’s an interesting footnote.
  4. A reviewer asked them to combine the pre and post election data to see if they could find a fertility/relationship interaction effect. When pre and post election data were kept separate, there was no effect. When they were combined, there was.

Point #4 is where things got a little interesting. The authors of the Harris and Mickes study said combining their data was not valid, but Durante et al hit back and said “why not?”. There’s an interesting piece of stat/research geekery about the dispute here, but the TL;DR version is that this could be considered a partial replication or a failure to replicate, depending on your statistical strategy. Unfortunately this is one of those areas where you can get some legitimate concern that a person’s judgement calls are being shaded by their view of the outcome. Since we don’t know what either researchers original plan was, we don’t know if either one modified their strategy based on results. Additionally the “is it valid to combine these data sets” question is a good one, and would be open for discussion even if we were discussing something totally innocuous. The political nature of the discussion intensifies the debate, but it didn’t create it.

Fast forward now to 2015, when yet another study was published: Menstrual Cycle Phase Does Not Predict Political Conservatism. This study was done using data ALSO from the 2012 election cycle3, but with a few further changes.  The highlights:

  1. This study, by Scott and Pound, addressed some of the “how do you measure fertility when you can’t test” concerns by asking about medical conditions that might influence fertility to screen out women whose self reporting might be less accurate. They also ranked fertility on a continuum as opposed to the dichotomous “high” and “low”. This should have made their assessment more accurate.
  2. The other two studies both asked for voting in terms of Romney vs Obama. Scott and Pound were concerned that this might capture a personal preference change that was more about Obama and Romney as people rather than a political change. They measured both self-reported political leanings and a “moral foundations” test and came up with an overall “conservatism” rank, then tracked that with chances of conception.
  3. They controlled for age, number of children, and other sociological factors.

So overall, what did this show? Well, basically, political philosophy doesn’t vary much no matter where a woman is in her cycle.

The authors have a pretty interesting discussion at the end about the problems with Mechanical Turk (where all three studies recruited their participants in the same few months), the differences of measuring person preference (Obama vs Romney) vs political preference (Republican vs Democrat), and some statistical analysis problems.

So what do I think now?

First off, I’ve realized that getting all ranty when someone brings up women’s hormones effecting things may be counterproductive. Lesson learned.

More seriously though, I find the hypothesis that our preferences for individuals may change with hormonal changes more compelling than the hypothesis that our overall philosophy of religion or government changes with our hormones. The first simply seems more plausible to me. In a tight presidential election though, this may be hopelessly confounded by the candidates actual behavior. It’s pretty well known that single women voted overwhelmingly for Obama, and that Romney had a better chance to capture the votes of married women. Candidates know this and can play to it, so if a candidate makes a statement playing to their base, you may see shifts that have nothing to do with hormones of the voters but are an actual reaction to real time statements. This may be a case where research in to the hypothetical (i.e. made up candidate A vs B) may be helpful.

The discussions on fertility measures and statistical analysis were interesting and a good insight in to how much study conclusions can change based on how we define particular metrics.  I was happy to see that both follow up papers hammered on clear and standard definitions for “fertility”. If that is one of  the primary metrics you are assessing, then the utmost care must be taken to assess it accurately, or else the signal to noise ratio can go through the roof.

Do I still think CNN should have taken the story down? Yes….but just as much as I believe that they should take most sensational new social/psych research stories down. If you follow the research for just two more papers, you see the conclusion go from broad (women change their social, political and religious views and votes based on fertility!) to much narrower (women may in some cases change their preference or voting patterns for particular candidates based on fertility, but their religious and political beliefs do not appear to change regardless). I’ll be interested to see if anyone tries to replicate this with the 2016 election, and if so what the conclusions are.

This concludes your trip down memory lane!
1. Gee, this is sounding familiar
2. This point was really interesting. He pointed out that around elections, pollsters are pretty obsessive about tracking things, and short of a major scandal breaking literally NOTHING causes a rapid 20 point swing. The idea that swings that large were happening regularly and everyone had missed it seemed implausible to him. Statistically of course, the authors were only testing that there was a difference at all, not what it was….but the large effect should possibly have given them pause. It would be like finding that ovulation made women spend twice as much on buying a house. People don’t change THAT dramatically, and if you find that they do you may want to rerun the numbers.
3. Okay, so I can’t be the only one noticing at this point that this means 3 different studies all recruited around 1000 American women not on birth control, not pregnant, not recently pregnant or breastfeeding but of child bearing age, interested in participating in a study on politics, all at the same time and all through Amazon’s Mechanical Turk. Has anyone asked the authors to compare how much of their sample was actually the same women? Does Mechanical Turk have any barriers for this? Do we care? Oh! Yes, turns out this is actually a bit of a problem.

Proof: Using Facts to Deceive (Part 7)

Note: This is part 7 in a series for high school students about reading and interpreting science on the internet. Read the intro and get the index here, or go back to Part 6 here.

Okay, now we come to the part of the talk that is unbelievably hard to get through quickly. This is really a whole class, and I will probably end up putting some appendices on this series just to make myself feel better.  If the only thing I ever do in life is to teach as many people as possible the base rate fallacy, I’ll be content. Anyway, this part is tough because I at least attempt to go through a few statistical tricks that actually require some explaining. This could be my whole talk, but I’ve decided against it in favor some of the softer stuff. Anyway, this part is called:

Crazy Stats Tricks: False Positives, Failure to Replicate, Correlations, Etc

Okay, so what’s the problem here?

Shenanigans, chicanery, and folks otherwise not understanding statistics and numbers. I’ve made reference to some of these so far, but here’s a (not-comprehensive) list:

  1. Changing the metric (ie using growth rates vs absolute rates, saying “doubled” and hiding the initial value, etc)
  2. Correlation and causation confusion
  3. Failure to Replicate
  4. False Positives/False Negatives

They each have their own issues. Number 1 deceives by confusing people, Number 2 makes people jump to conclusions, Number 3 presents splashy new conclusions that no one can make happen again, and Number 4 involves too much math for most people but yields some surprising results.

Okay, so what kind of things should we be looking out for?

Well each one is a little different. I touched on 1 and 2 a bit previously with graphs and anecdotes. For failure to replicate, it’s important to remember that you really need multiple papers to confirm findings, and having one study say something doesn’t necessarily mean subsequent studies will say the same thing. The quick overview though is that many published studies don’t bear out. It’s important to realize that any new shiny study (especially psychology or social science) could turn out to not be reproducible, and the initial conclusions invalid. This warning is given as a boilerplate “more research is needed” at the end of articles, but it’s meant literally.

False positives/negatives are a different beast that I wish more people understood.  While this applies to a lot of medical research, it’s perhaps clearest to explain in law enforcement.  An example:

In 2012, a (formerly CIA) couple was in their home getting their kids ready for school when they were raided by a SWAT team. They were accused of being large scale marijuana growers, and their home was searched. Nothing was found.  So why did they come under investigation? Well it turns out they had been seen buying gardening equipment frequently used by marijuana growers, and the police had then tested their trash for drug residue. They got two positive tests, and they raided the house.

Now if I had heard this reported in a news story, I would have thought that was all very reasonable. However, the couple eventually discovered that the drug test used on their trash has a 70% false positive rate. Even if their trash had been perfectly fine, there was still at least a 50% they’d get two positive tests in a row (and that assumes nothing in their trash was triggering this). So given a street with ZERO drug users, you could have found evidence to raid half the houses.  The worst part of this is that the courts ruled that the police themselves were not liable for not knowing that the test was that inaccurate, so their assumptions and treatment of the couple were okay. Whether that’s okay is a matter for legal experts, but we should all feel a little uneasy that we’re more focused on how often our tests get things right than how often they’re wrong.

Why do we fall for this stuff?

Well, some of this is just a misunderstanding or lack of familiarity with how things work, but the false positive/false negative issue is a very specific type of confirmation bias. Essentially we often don’t realize that there is more than one way to be wrong, and in avoiding one inaccuracy, we increase our chances of different types of inaccuracy.  In the case of the police departments using the inaccurate tests, they likely wanted something that would detect drugs when they were present. They focused on making sure they’d never get a false negative (ie a test that said no drugs when there were). This is great, until you realize that they traded that for lots of innocent people potentially being searched. In fact, since there are more people who don’t use drugs than those who do, the chances that someone with a positive test doesn’t have drugs is actually higher than the chance that they do….that’s the base rate fallacy I was talking about earlier.

To further prove this point, there’s an interesting experiment called the Wason Selection task that shows that when it comes to numbers in particular, we’re especially vulnerable to only confirming an error in one direction. In fact 90% of people fail this task because they only look at one way of being wrong.

Are you confused by this? That’s pretty normal. So normal in fact that the thing we use to keep it all straight is literally called a confusion matrix and it looks like this:

If you want to do any learning about stats, learn about this guy, because it comes up all the time. Very few people can do this math well, and that includes the majority of doctors. Yup, the same people most likely to tell you “your test came back positive” frequently can’t accurately calculate how worried you should really be.

So what can we do about it?

Well, learn a little math! Like I said, I’m thinking I need a follow up post just on this topic so I have a reference for this. However, if you’re really not mathy, just remember this: there’s more than one way to be wrong. Any time you reduce your chances of being wrong in one direction, you probably increase them in another. In criminal justice, if we make sure we never miss a guilty person, we might also increase the number of innocent people we falsely accuse. The reverse is also true. Testings, screenings, and judgment calls aren’t perfect, and we shouldn’t fool ourselves in to thinking they are.

Alright, on that happy note, I’ll bid you adieu for now. See ya next week!

Read Part 8 here.

Coming this February….

As I’ve mentioned in a few comments/conversations around here, one of the main goals of my current blogging kick has been to come up with some more defined project for myself and/or ongoing series. I’ve had quite a bit of fun with the “Intro to Internet Science” posts, and plan to do some other (hopefully) interesting things in the future.

Starting in February, I’m going to roll out a few of these ideas and see what works or at least keeps me entertained. As I start these series I’ll be adding them here, and you can find links to the individual series in the drop down at the top. In addition to a few A few things to look forward to:

Little Miss Probability Distribution: I’ve been obsessed with probability distributions and their relationships with each other, and I need to work that out somehow. Get ready to meet them and see how the get along.

From the Archives: As many reader know, I blogged quite a bit in 2012 and 2013 on all sorts of random issues. Most of that was pre-stats degree, so I’m taking a look in my archives to dig up some old posts and see what I’d say about them now.

Grade an Infographic: Infographics still drive me nuts. I am taking a red pen to them.

Math Words for People Who Like English: I had a really funny conversation with a language obsessed friend about some of the more fun words that exist in the world of math and statistics. I’m going to be highlighting a few of these for her and anyone else who is interested.

Book Suggestions for the Autodidact: I put up a few book lists recently, and I decided I’m going to keep a running list of my favorites for people who want more. You can find it in the bar at the top, or access the ongoing list here. I’ll be changing the number in the title as I add things.

Additionally, I’m going to keep up my R&C posts, where I deep dive/sketch out the different parts of a study either related to my life or the news, and probably keep up the personal life advice column, which keeps cracking me up. As I noted last week, reader questions are always welcome, and can be submitted here.

Proof: Using Facts to Deceive (Part 6)

Note: This is part 6 in a series for high school students about reading and interpreting science on the internet. Read the intro and get the index here, or go back to part 5 here.

Okay, I’ll be honest here: this part is one of the hardest parts of my talk to cover. The issue I’m going to talk about here is another framing issue, and it has to do with what experts get quoted on what issues and in what proportions. This is a huge issue open to broad interpretations and many legitimate approaches, so I’m going to intentionally tread lightly here.  A large amount about what you feel is deceptive here will depend on what you already believe.  Additionally, when I cover this in the classroom, I have a pretty good idea that there won’t be any raging conspiracy theorists seating in the seats.  Not so on the internet. I’ve been blogging off and on for about a decade now, and you would not believe how many people do key word searches so they can pop in and spew their theories….so forgive me if I speak in generalities. Oh yes, it’s the controversial issue of:

Experts and Balance

Okay, so what’s the problem here?

The problem, in general, is a public misunderstanding about how science works. Not everyone is a scientist, and that’s okay. We often rely on experts to interpret information for us. This is also okay. In the age of the internet though, almost anyone can find an expert or two to back up their own view. Everyone wants to be the first to break a story, and much can get lost in the rush to be on top of the latest and greatest thing. Like, you know, evidence.

Okay, so what kinds of things should we be looking out for?

Well, there are two sides to this coin. The classic logical fallacy here is argumentum ad verecundiam, or “argument from authority”.  Kinda like this guy:

…though my three year old tells me he’s pretty cool.  In all seriousness though, “TV doctors” love to get up and use their credentials to emphasize their points. Their reach can be enormous, but research has found that over half the claims of people like Dr Oz are either totally unsubstantiated or flat out contradicted by the evidence. Just because someone has a certain set of credentials doesn’t mean they’re always right.


So if the popular credentialed people aren’t always right, then good old common sense can guide us right? No, sadly, that’s not true either. The flip side of arguing from authority is “appeal to the common man”, where you respect someone’s opinion because they’re not an authority. For medicine you frequently hear this as “the secret doctors don’t want you to know!” or “my doctor said my child was ______, but as a mother my heart knew that was wrong” (side note: remember that mother’s who turn out to be wrong almost never get interviewed). For some people, this type of argument is even stronger than the one above….but that doesn’t mean it’s not fallacious.

So basically, the water gets really murky because almost anyone can claim to know stuff, cant throw out credentials that may or may not be valid or relevant, can throw out research that may or may not be valid, and otherwise sound very compelling. Yeesh.

Complicating matters even further is the idea of balance and false balance. Balance is when a reporter/news cast presents two opposing sides and gives them both time to state their case. False balance is when you give two wildly unequal sides the same amount of time.

All of this can seem pretty reasonable when it comes to hotly debated topics, like say, nutrition and what we should be eating. If you want to pit the FDA vs Gary Taubes vs Carbsane, I will watch the heck out of that. But there are other issues where the debate gets a little harrier, and the stakes get much higher….like say criminal trials. Do you want a psychic on the stand getting time to explain why they think you’re a murderer? Do you want them getting as much time as the forensics experts who say you aren’t?

At some point we have to say it….science does back up certain opinions more than others, and some experts are more reliable than others. Where you draw the line, sadly, probably depends on what you already believe about the topic.

Why do we fall for this stuff?

Well, partially because we should.  On the whole, experts are probably a pretty good bet when it comes to most scientific matters. They may be wrong at times (just ask Barry Marshall), but I have a lot of faith in science on the whole to move forward and self correct. The scientific process is quite literally mans attempt to correct for all of our fallacies in order to move forward based on reality.  It’s a lofty goal, and we’re not always perfect, but it’s start. We listen to experts because as people with more training, more experience and more context than us actually do frequently do better at controlling their biases.

On the other hand, those of us who have been burned might start to love the anti-hero instead. The idea that a lone wolf can take on the establishment is so cool! Because truthfully sometimes the establishment sucks. People are misdiagnosed, treated rudely, and otherwise incorrectly cast aside. Sometimes “crazy” ideas do turn out to be right. Being a contrarian isn’t always the worst way to go….as my favorite George Bernard Shaw quote says “The reasonable man adapts himself to the world; the unreasonable one persists in trying to adapt the world to himself. Therefore all progress depends on the unreasonable man.”  Every progress maker is a bit unreasonable at times.

So what can we do about it?

So I may have made it sound like it’s not possible to know anything. That’s not true. Science is awesome, but you have to do a little work to figure out what’s going on. So if you really care about an issue, do a little homework. Read the best and brightest minds that defend the side you don’t agree with. Don’t just read what your side says the other side is saying, read the other side. Read the best of what they have to offer….but check their sources. If they prove to be not-credible on one topic, treat them with suspicion going forward. Scientists should not have to play fast and loose with the truth to get where they need to go. Be suspicious of anyone who does this. Beware of anything that sounds too neat, too clean, too cutting edge. Science and proof move slowly.

Also, follow the money….but remember that works both ways. I work in oncology and there are people who will tell you the treatments we offer are crap and that they have better ones. Evidence to the contrary is dismissed as us not wanting to lose our money. However, the people making these claims frequently make 10 to 20 times what our doctors make. They throw out numbers that represent our whole hospital, while neglecting to mention that their personal income far exceeds any individual employee we have. People make tons of money peddling alternatives.

And if all else fails, just ask a math teacher:

No one’s questioning that a2 + b2 = c2 stuff. Well, except this guy.

Alright, that’s it for part 6….see you next week for part 7!  Read Part 7 here.

Immigration, Poverty and Gumballs

A long time reader (hi David!) forwarded this video and asked what I thought of it:

It’s pretty short, but if you don’t feel like watching it, essentially it’s a video put out by a group attempting to address whether or not immigration to the US can reduce global poverty.  He uses gumballs to represent the population of people in the world living in poverty (one gumball = one million people), and ultimately concludes that immigration will not solves global poverty.

Now, I’m not the most educated of people when it comes to immigration issues, but I was intrigued by his math based demonstration. At one point he even has gumballs fall all over the floor, which drives home exactly how screwed we are when it comes to fixing global poverty. But do I buy it? Are the underlying facts correct? Is this a good video? Well, lets take a look:

First, some context: Context is frequently missing on Facebook, and it can be useful to know the background of what you’re seeing when there’s a video like this.  I did some digging, so here goes:  The man in the video is Roy Beck, who founded a group called Numbers USA, website here. Their tag line is “for lower immigration levels”, and unsurprisingly, that’s what they want.  The video, and presumably the numbers in it, are from 2010.  I thought the name NumbersUSA sounded ambitious, but I did find they have an “Accuracy Guarantee” on their FAQ page promising they would take down any inaccurate numbers or information. I don’t know if they do it (and they have not responded to my complaint yet), but that was cool to see.

Now, the argument:  To start the video, Mr Beck lays out his argument by quantifying the number of desperately poor people in the world. He clarifies that “desperately poor” is defined by the World Bank standard of “making less than two dollars a day”. He begins to name the number of desperately poor people in various regions of the world, and stacks gumballs to represent all of these regions. The number is heartbreakingly high and it worsens as he continues….but when his conclusion came to about half the globe (3 billion people or 8 larger containers of gumballs) living at that level, I was skeptical. I’ve done some reading on extreme poverty, and I didn’t think it was that high. Well, it turns out it isn’t. It’s actually about 12.7% or 890 million. That’s only about 30% of the number he presents….maybe about 3 containers of gumballs instead of 8.

Given that that the video was older (and that extreme world poverty has been declining since the 1980s) I was trying to figure out what happened, so I went to this nifty visualization tool the World Bank provides. You can set the poverty level (less than $1.90/day or less than $3.10/day) and you can filter by country or region.  Not one of the numbers given is accurate. They haven’t even been accurate recently, as far as I can tell. For example, in 2010, China had 150 million people living on under $2/day.  In the video, he says 480 million, where China was in the year 2000 or so.  For India, he uses 890 million, a number I can’t find ever published by the World Bank.  The highest number they list for India at all is 430 million. The best I can conclude is that the numbers he shows here are actually those living under the $3.10/day level, which seem closer. Now $3.10/day is not rich by any means, but it’s not what he asserted either. He emphasizes the “less than 2 dollars a day” point multiple times.  At that point I figured I wasn’t going to check out the rest of the numbers….if the baseline isn’t accurate, anything he adds to it won’t be either. [Edit: It’s been pointed out to me that at the 2:04 mark he changes from using the $2/day standard to “poorer than Mexico”, so it’s possible the numbers after that timepoint do actually work better than I thought they would. It’s hard to tell without him giving a firm number. For reference, it looks like in 2016 the average income in Mexico is $12,800/year .]  It was at this point I decided to email the accuracy check on his website to ask for clarification, and will update if I hear back. I am truly interested in what happened here, because I did find a few websites that gave similar numbers to his….but they all cite the World Bank and all the links are now broken. The World Bank itself does not appear to currently stand by those statistics.

So did this matter? Well, yes and no. His basic argument is that we have 5.6 billion poor people. That grows every year by 80 million people each year. Subtract out 1 million immigrants to the US each year, and you’re not making a difference.  Even if those numbers are wildly different from what’s presented, the fundamental “1 million immigrants doesn’t make much of a dent in world poverty” probably stands.

But is that the question?

On the one hand, I’ll grant that it’s possible “some people say that mass immigration in to the United States can help reduce world poverty”, as he says to open his video. I do not engage much in immigration debates, but I wasn’t entirely sure that “reduce world poverty” was the primary argument. NumbersUSA puts out quite a few videos on many different topics, so it’s interesting that this one appears to be their most viral.  It currently has almost 3 million views, and most of their other videos don’t have even 1% of that. Given that “solve world poverty” is not one of the stated goals or arguments of the immigration organizations I could find, why was this so shared? I did find some evidence that people argue about immigrants sending money back to their home countries helping poverty, but that is not really addressed in this video. So why did so many people want to debunk an argument that is not the primary one being made?

My guess is the pretty demonstration. I covered in this post about graphs and technical pictures, that these sorts of additions seem to make us think an argument is more powerful than we would have otherwise. In this case, it seems a well demonstrated about magnitude and subtraction is trumping most people’s realizations that this is not arguing a point that is commonly made.

Now if the numbers aren’t accurate, that’s even more irritating (his demonstration would not have looked quite as good if it had 3 containers at the start instead of 8), but I’m not sure that’s really the point. These videos work in two ways, both by making an argument that will irritate people who disagree with you, and by convincing those who agree with you that you’ve answered the challenges you’ve gotten. It’s a classic example of a straw man…setting up an argument you can knock down easily. My suspicion is when you do it with math and a colorful demonstration, it convinces people even more. Not the fault so much of the video maker, as that of the consumer.  While it’s possible Mr Beck will reply to me and clarify his numbers with a better source, it looks unlikely. Caveat emptor.

Got a question/meme/thing you want explained or investigated? I’m on it! Submit them here.

New Feature: Reader Questions

I’m starting a new feature here that I’ve been doing informally for a while now: reader questions. While I like to amuse myself with my stats based/personal life advice column, I get far more requests for feedback on random things readers come across and want someone to weigh in on.  So….if you have a question, see something irritating on Facebook, or just generally want someone to take a look at the numbers, get in touch here.

Proof: Using Facts to Deceive (Part 5)

Note: This is part 5 in a series for high school students about reading and interpreting science on the internet. Read the intro and get the index here, or go back to part 4 here.

Okay! So we’re almost half way done with the series, and we’re finally reaching the article!  Huzzah! It may seem like overkill to spend this much time talking about articles without, you know, talking about the articles, but the sad truth is by the time you’ve read the headline and looked at the picture, a huge amount of your opinion will already be forming. For this next section, we’re going to talk about the next thing that will probably be presented to you: a compelling anecdote. That’s why I’m calling this section:

The Anecdote Effect

Okay, so what’s the problem here?

The problem here isn’t really a problem, but a fundamental part of human nature that journalists have known for just about forever: we like stories. Since our ancestors gathered around fires, we have always used stories to illustrate and emphasize our points. Anyone who has even taken high school journalism has been taught something like this. I Googled “how to write an article”, and this was one of the first images that came up:

Check out that point #2 “Use drama, emotion, quotations, rhetorical questions, descriptions, allusions, alliteration and metaphors”. That’s how journalists are being taught to reel you in, and that’s what they do. It’s not necessarily a problem, but a story is designed to set your impressions from the get go.  That’s not always bad (and pretty much ubiquitous) but it is difficult when it leaves you with an impression that the numbers are different than they actually are.

What should we be looking out for?

Repeat after me: the plural of anecdote is not data.

From smbc.com

Article writers want you to believe that the problem they are addressing is big and important, and they will do everything in their power to make sure that their opening paragraph leaves you with that impression. This is not a bad thing in and of itself (otherwise how would any lesser known disease or problem get traction?), but it can be abused.  Stories can leave you with an exaggerated impression of the problem, and exaggerated impression of the solution, or an association between two things that aren’t actually related.  If you look hard enough, you can find a story that backs up almost any point you’re trying to make.  Even something with a one in a million chance happens 320 times a day in the US alone.

So don’t take one story as evidence. It could be chance. They could be lying, exaggerating, or mis-remembering.  I mean, I bet I could find a Mainer who could tell me a very sad story about how their wife changing their shopping habits to less processed food led to their divorce.  I could even include this graph with it:

chart

Source.  None of this however, would mean that margarine consumption was actually driving divorce rates in any way.

Why do we fall for this stuff?

Nassim Taleb has dubbed this whole issue “the narrative fallacy”, the idea that if you can  tell a story about something, you can understand it. Stories allow us to tie a nice bow around things and see causes and effects where they don’t really exist.

Additionally, we tend to approach stories differently than we approach statistics. One of the most interesting meditations on the subject is from John Allen Paulos in the New York Times here. He has a great quote about this:

In listening to stories we tend to suspend disbelief in order to be entertained, whereas in evaluating statistics we generally have an opposite inclination to suspend belief in order not to be beguiled.

I think that sums it up.

So what can we do about it?

First and foremost, always remember that story or statistic that opens an article is ultimately trying to sell you something, even if that something is just the story itself.  Tyler Cowen’s theory is that the more you like the story, the more you should distrust it.

Even under the best of circumstances, people can’t always be trusted to accurately interpret events in their own life:

Source.

Of course, this almost always works the opposite way. People can be very convinced that the Tupperware they used while pregnant caused their child’s behavior problems, but that doesn’t make it true. Correlation does not prove causation in even a large data set, and especially not when it’s just one story.

It also helps to be aware of words that are used, and to think about the numbers behind them. Words like “doubled” can mean a large increase, or that your chances went from 1 in 1,000,000,000 to 1 in 500,000,000. Every time you hear a numbers word, ask what the underlying number was first.  This isn’t always nefarious, but it’s worth paying attention to.

One final thing with anecdotes: it’s an unfortunate fact of life that not everyone is honest. Even journalists with fact checkers and large budget can totally screw up when presented with a sympathetic sounding source. This week, I had the bizarre experience of seeing a YouTube video of a former patient whose case several coworkers worked on. She was eventually “cured” by some alternative medicine, and has taken to YouTube to tell her story.  Not. One. Part. Of. What. She. Said. Was. True. I am legally prohibited from even pointing you in her direction, but I was actually stunned at the level of dishonesty she showed. She lied about her diagnosis, prognosis and everything in between. I had always suspected that many of these anecdotes were exaggerated, but it was jarring to see someone flat out lie so completely. I do believe that most issues with stories are more innocent than that, but don’t ever rule out “they are making it up”, especially in the more random corners of the internet.

By the way, at this point in the actual talk, I have a bit of break the fourth wall moment. I point out that I’ve been using the “tell a story to make your point” trick for nearly every part of this talk, and that they are most certainly appreciating it more than if I just came in with charts and equations. The more astute students are probably already thinking this, and if they’re not thinking it, it’s good to point out how it immediately relates.

Until next week!  Read Part 6 here.

5 Statistics Books You Should Read

Since I’m on a bit of a book list kick at the moment, I thought I’d put together my list of the top 5 stats and critical thinking books people should read if they’re looking to go a bit more in depth with any of these topics.  Here they are, in no particular order:

If you’re looking for….a good overview:
How to Lie with Statistics

This is one of those books that should be given to every high school senior, or maybe even earlier. In fact, I know more than a few people who give this out as a gift. It’s 60 years old, but it still packs a punch. It’s written by a journalist, not a statistician, so it’s definitely for the layperson.

If you’re looking for….something a bit more in depth:
Thinking Statistically

If you want to know how to think about statistical concepts without actually having to do any math, this book is for you. What I would get my philosophy major brother for Christmas so we could actually talk about things I’m interested in for once.

If you’re looking for….something a little more medical:
Bad Science: Quacks, Hacks, and Big Pharma Flacks

Ben Goldacre is a doctor from the UK, so it’s no surprise he focuses mostly on bad interpretations of medical data.  He calls out journalists, popular science writers and all sorts of other folks in the process though, and helps consumers be more educated about what’s really going on.

If you’re looking for….something that will actually help you pass a class:
The Cartoon Guide to Statistics

Not a very advanced class, but a pretty solid re-explaining of stats 101. I keep this one at work and hand it out when people have basic questions or want to brush up on things.

If you’re looking for….a handy guide for those who actually get stats:
Statistical Rules of Thumb

This is one of the few textbooks I actually bought just to have on hand and to flip through for fun. It’s pricey compared to a regular book, but worth it if you’re using statistics a lot and need a in depth reference book. It contains all those “real world” reminders that statisticians can forget if they’re not paying attention. With different sections for basics, observational studies, medicine, etc, and advice like “beware linear models” and “never use a pie chart”, this is my current favorite book.

As always,  further recommendations welcome!

Pictures: Trying to Distract You (Part 4)

Note: This is part 4 in a series for high school students about reading and interpreting science on the internet. Read the intro and get the index here, or go back to part 3 here.

When last we met, we covered what I referred to as “narrative pictures”, or pictures that were being used to add to the narrative part of the story.  In this section, we’re going to start looking at pictures where the problems are more technical in nature…ie graphs and sizing. This is really a blend of a picture problem and a proof problem, because these deceptions are using numbers not narratives.   Since most of these issues are a problem of scales or size, I’m calling this section:

Graphs: Changing the View

Okay, so what’s the problem here?

The problem, once again, is a little bit of marketing. Have you ever judged the quality of a company based on how slick their website looks? Or judged a book by it’s cover, to coin a phrase? Well, it turns out we’re very similar when it comes to judging science. In a 2014 study, (Update: this lab that performed this study has come under review for some questionable data practices. It is not clear if this study is affected, but you can read the details of the accusations here and here) researchers gave people two articles on the effectiveness of a made up drug. The text of both articles was the same, but one had a graph that showed the number of people the drug helped, the other did not.  Surprisingly, 97% of the people who saw the graph believed the drug worked, whereas only 68% of people who read the text did. The researchers did a couple of other experiments, and basically found that not just graphs, but ANY “science-ish” pictures (chemical formulas, etc) influenced what people thought of the results.

So basically, adding graphs or other “technical” pictures to things to lend credibility to their articles or infographic, and you need to watch out.

Okay, so what kind of things should we be looking out for?

Well, in many cases, this isn’t a really a problem. Graphs or charts that reiterate the point of the article are not necessarily bad, but they will influence your perception. If the data warrants it, a chart reiterating the point is fantastic. It’s how nearly every scientific paper written operates, and it’s not inherently deceptive….but you may want to be aware that these pictures by themselves will influence your perception of the data. Not necessarily a problem, but good to be aware of under any circumstance.

There are some case though, where the graph is a little trickier.  Let’s go through a few:

Here’s one from Jamie Bernstein over at Skepchick, who showed this great example in a Bad Chart Thurday post:pica

Issue: The graph y-axis shows percent of growth, not absolute value. This makes hospitalized pica cases look several times larger than anorexia or bulimia cases. In reality, hospitalized anorexia cases are 5 times as common and bulimia cases are 3 times as common as pica cases. These numbers are given at the bottom, but the graph itself could be tricky if you don’t read it carefully.

How about this screen shot from Fox News, found here?

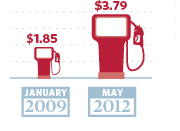
 Issue: Visually, this chart shows the tax rate will quadruple or quintuple if the Bush tax cuts aren’t extended. If the axis started at zero however, the first bar would be about 90% the size of the second one.

How about this tweeted graph from shared by the National Review?

Issue: The problem with this one is the axis does start with zero. The Huffington Post did a good cover of this graph here, along with what some other graphs would look like if you set the scale that large. Now of course there can be legitimate discussion over where a fair axis scale would be, but you should make sure the visual matches the numbers.

And one more example that combines two issues in one:

See those little gas pumps right there? They’ve got two issues going on. The first is a start date that had an unusually low gas price:

gas

The infographic implies that Obama sent gas prices through the roof….but as we can see gas prices were actually bizarrely low the day he took office.  Additionally, the gas pumps involved are deceptive:

b1fb2-gas

If you look, they’re claiming to show that prices doubled. However, the actual size of the second one is four times the one of the first one.  They doubled the height and the width:

76fed-gas2

While I used a lot of political examples here, this isn’t limited to politics. Andrew Gelman caught the CDC doing it here, and even he couldn’t figure out why they’d have mucked with the axis.

There’s lots of repositories for these, and Buzzfeed even did a listicle here if you want more. It’s fun stuff.

Why do we fall for this stuff?

Well, as we’ve said before, visual information can reinforce or skews your perceptions, and visual information with numbers can intensify that effect. This isn’t always a bad thing…after all nearly every scientific paper ever published includes charts and graphs. When you’re reading for fun though, it’s easy to let these things slip by. If you’re trying to process text, numbers, implications AND read the x and y axis and make sure the numbers are fairly portrayed, it can be a challenge.

So what can we do about it?

A few years ago, I asked a very smart colleague how he was able to read and understand so many research papers so quickly. He seemed to read and retain a ton of highly technical literature, while I always found my attention drifting and would miss things. His advice was simple: start with the graphs. See I would always try to read papers from start to finish, looking at graphs when they were cited. He suggested using the graphs to get a sense of the paper, then read the paper with an eye towards explaining the graphs. I still do this, even when I’m reading for fun. If there’s a graph, I look at it first when I know nothing, then read the article to see if my questions about it get answered. It’s easier to notice discrepancies this way. At the very least, it reminds you that the graph should be there to help you. Any evidence that it’s not should make you suspicious of the whole article and the author’s agenda.

So that wraps up our part on Pictures! In part 5, we’ll finally reach the text of the article.

Read Part 5 here.

Math Books for Young Kids

After my post of my own new years resolution reading, I thought it might be interesting to follow up with a couple of new books I got my son for Christmas.  He’s 3 and has officially moved from merely being able to recite numbers to actually being able to count objects.  While obviously he’s a bit young for statistics, I want to get him introduced to the world of math and some of the people who inhabit it early. Relatedly, here’s a nifty math skills/developmental chart I found for early childhood.

These are some of the books I’m using:

Bedtime Math: This Time It’s Personal (Bedtime Math Series Book 2)
This one we started using immediately, and it’s quite fun. Basically this is a four book series, created by a mom who realized that while kids get introduced to reading in a fun environment (home, in a parents lap before bed) they get introduced to math in a much less fun setting (later in a classroom). She decided to fix that by putting out books of funny math problems kids could do at home before bed. It has problems for several age groups, starting at around 3. Very fun, and a nice balance for traditional bed time routines.

Curious George Learns to Count from 1 to 100
This one is a big favorite, though we don’t make it quite to 100 yet. Curious George is my son’s hero right now, so I figured I’d use it to encourage him to go further in his counting.

The Boy Who Loved Math: The Improbable Life of Paul Erdos
I’ve mentioned my own obsession with Paul Erdos, and I’m trying to pass it on. Erdos apparently would call children “epsilons”, but Finn doesn’t seem to be taking to that name. This one’s a little long for a 3 year old, but it’s interesting and the illustrations are amazing.

Blockhead: The Life of Fibonacci
This one was recommended to me by my favorite children’s librarian (hi Tracy!). It’s about Fibonacci and is another one that’s slightly too long for a 3 year old, but interesting and historically enlightening. Mathematicians tend to be really fascinating people.

Introductory Calculus For Infants
Because it’s never too early to start.

Experimenting with Babies: 50 Amazing Science Projects You Can Perform on Your Kid
This one’s for mama.