Would you believe in a love at first sight? Yes I’m certain that it happens all the time.
-John Lennon and Paul McCartney (cowriters)
This week’s question comes from a little known group called “The Beatles”. It’s from their song “With a Little Help From My Friends“1, and the sentiment was raised by my friend John when we were discussing relationships. Now John’s a little bit of a hopeless romantic pragmatic idealist, so the idea of love at first sight kind of appeals to him. But does it exist? And more importantly, does it really happen all the time? Let’s take a look!
Alright, let’s be honest here…the question of whether or not you can really fall in love at first sight is one typically addressed by philosophical debates, not statisticians. Literally everyone has an opinion on this, and often a strong one. It’s a question that inspires all sorts of crazy debates, tons of movies, countless songs, and a mildly disturbing yet rather watchable reality show. I’m not a philosopher and I’m not getting in to all of that “what is love” junk2, but I can tell you in the dating market it’s kind of a guy thing. In a user survey done by Match.com, they found that about 60% of men believed in it, and 40% said it had happened to them. For women, those numbers were about 50% and 30%, respectively. Those numbers would suggest that John and Paul were on to something, as it certainly seems to be a pretty common occurrence. But is that the whole story?
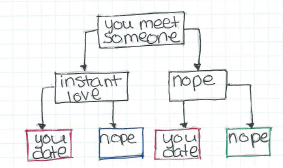
What jumps out at me as a I pondered this question was a concept known as the toupee fallacy. This seems to be one of those questions where the facts we’re not seeing might be as important as the ones we are seeing. I’m concerned that there’s some silent evidence at play here, and we may be missing a few things. Namely, we’re not seeing how often people think they’ve fallen in love at first sight, only to be quickly disappointed. Whatever this feeling or moment we are talking about is only gets counted if it works. Here, let me illustrate:
It all looks so easy, doesn’t it?
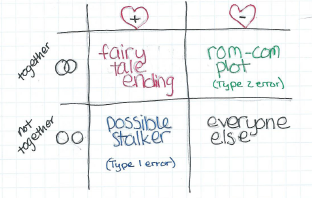
So pretty much everyone we meet falls in one of those 4 boxes. When we talk about love at first sight though, we often only talk about it in the context of those two red boxes, ie people who wind up together. What we can’t forget about is that blue box there…those we meet, feel an instant attraction to that never pans out. Here’s the same information put another way:
Possible Stalker/Type 1 error is my new band name.
Now what we’re generally going for in life is either the box in red or the box in black. In stats terms the red ones are true positives (falling in love with someone who loves you) and the black are true negatives (not falling in love with someone who doesn’t love you). The other two boxes are actually what we’d call Type 1 errors and Type 2 errors….ie, the chance that we make the wrong call initially. If we presume the null hypothesis is that most people don’t love us3, we can call the box in blue, our type 1 error and the box in green our type 2 error. In love, we almost always prefer Type 2 errors….in other words, we want to find out we loved someone when we didn’t realize it rather than fall in love with someone who doesn’t like us.
But what influences the number of people who fall in each box? Well, for that we have to take a look at the words that make up both of our conditions.
Let’s start with “end up together”.
During the discussion that prompted this question, John and I were specifically chatting about people who end up married. Now, in 2015, this may not be a great metric to go by. Many people who are in love do not get married, date or cohabitate for much longer than past generations, or otherwise define their loving relationships differently. The point is not to cover every possible scenario, but rather to remind people that the more narrowly you define “end up together” the less likely it is to happen from a strictly statistical point of view. For example, in the numbers I gave in the beginning of the post, 40% of men said they had fallen in love at first sight…but these were men participating in a survey for singles on a dating website. Of course some of those men could have been widows, but the rest of them either ended the relationship that started with love at first sight, or had it ended for them. Does this count? Some will say yes, others will say no. Your standards will influence how many people are covered by that first row.
Now, “didn’t end up together” seems more straightforward, but it actually can also cover a range of scenarios. I made a joke in my table about someone who falls in love with someone who doesn’t love them being a stalker, but that’s not the whole story. Most of us have met someone who we thought was awesome….for 5 seconds until they opened their mouths. Or until part way through the first date. Or two weeks later when you saw their massive teddy bear collection. You get the picture. The point is, not ending up with someone can mean a whole lot of things from “they were taken” to “we decided we were better as friends”. How broadly you define this will also determine how often people fall in this category.
Love At First Sight (LAFS)
Alright, lets move on to love at first sight. How are we defining this and how often is it happening? Well, this one can get interesting. LAFS is one of those things people tend to define by saying things like “if you have to ask, it didn’t happen”. You know it when you see it. This makes it ripe for hijinks and chicanery, which I’ll get in to in a minute. In it’s most basic sense though, everyone seems to agree it’s some sort of overwhelming feeling of attraction bordering on feeling magnetically pulled towards a person. How broadly you define this, and how often you think this has happened to you already are going to effect the number of people in that box.
So now that we’ve got some definitions, let’s put some generally fictitious numbers in those boxes. Let’s say you’ve met about 1000 people in the generally correct age/gender/orientation that you’re attracted to. Here’s what happened with them. You’ve dated about 20, and twice think you felt something that could have been LAFS. One of those worked out, one didn’t. Your percentages are here. We get these numbers:

There’s a Taylor Swift song somewhere in here.
So unfortunately, the chances are kind of small. You can run the numbers for your own life, but my guess is it will be pretty small there too.
But John and Paul promised me! You said they were on to something!
Okay, you got me. So what’s going on here?
Well, the answer is really that we don’t actually often think of this in the terms I put above. We’re not evaluating our own lives and our own chances, we’re trying to go off of other people’s experiences. We are not calculating overall probabilities like I did above, we’re doing conditional probabilities. No one asks people what happened when they didn’t find love, we ask them what happens when they did find love. In stats this is a huge difference. We just went from a regular probability to a conditional probability. Basically, it’s the difference between these two equations:
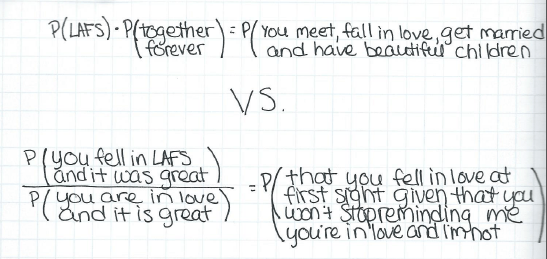
P here is “probability” and the rest is about how I’m totally not bitter.
That first equation gives us a .01% chance, and the second one gives us a 5% chance, using the numbers above. That’s 500 times higher!
And this is assuming everyone’s being honest about who they’re putting in what box. Spoiler alert: they’re not.
Most of this isn’t intentional though. It’s just that as humans, we don’t tend to remember all the details of good events. In fact, our memories of bad events are much stronger and typically more detailed. So when two people fall in love and things work out, they will likely not really remember the moments of doubt or insecurity that may have actually been present in the beginning of their relationship. They will retell the story more amusingly and more positively than the actual events may have warranted. This is so prevalent in fact that it is actually considered a hallmark of a healthy relationship. We can infer then that by only talking to people in happy relationships, we may actually be overestimating how many people met and “just knew”4. That’s why research on this is so sparse….the data confounds itself.
Ugh, well that’s not great news.
No, and it gets worse. When John and Paul claimed that this happened all the time, they were likely right….but that won’t help you. For example, let’s say that 1 out of 1000 people every year are likely to experience un-exaggerated, for real, LAFS with someone they stay with. That’s about 25,000 people a year in the USA. That’s 67 a day. You will almost certainly know some of these people….but they may not ever be you. Bummer.
Got any more good news?
Well yeah, actually, I do! See, the thing is, LAFS may not even be the ideal here. There’s actually some interesting evidence that people who date for longer stay married longer5. Apparently it’s long engagements that threaten marital stability, not long dating periods. So while those in the LAFS/stay together box may get a lot of attention, the ones in the no LAFS/stay together box may be quietly outdoing them. Also, when finding true love, most people really are more interested in the exponential distribution, not the Poisson distribution6. In other words, we’re not so concerned about the number of events, but rather how long we have to wait for it! Once you find the one, you probably won’t care so much how it happens, and evidence suggests that you and your beloved will keep altering your story bit by bit until it’s worthy of it’s own movie with the attractive Hollywood folks of your choice. You’ll get there. May your W = time to first event be short, and your moment generating function be beautiful.
1. Weird fact I learned about this song while researching this post: the first line was originally “what would you do if I sang out of tune, would you throw ripe tomatoes at me?” but Ringo made them change it when he realized their rabid fans might take it seriously. ↩
2. Baby don’t hurt me.↩
3. Okay, emo kid.↩
4. If you ever want to see this in action, find a friend who you knew pre and post divorce. If you know the story of how they met their ex, it’s really interesting to ask them again after their divorce. It is almost guaranteed the story will have changed, gotten briefer or otherwise be a bit altered. Do NOT point this out to them. Don’t ask me how I know this.↩
5. Some of this data is kinda old…marriage and dating practices have changed rapidly over the last few decades. Caveat emptor.↩
6. Our love is anything but a normal distribution!↩