I was on Twitter/X recently and ended up following two rather interesting conversations started by Tweets with strong claims. Of course I can’t find them again, but one asserted that teachers unions were the cause of our educational problems in this country, and the other asserted that the only way to fix the falling birth rate was to raise the status of men in this country. Both of these were interesting enough for me to start following the thread, and people quickly countered them both.
For the teacher’s union claim, it was pointed out that there are 5 states where teachers can unionize, but they are not allowed to do any collective bargaining: Texas, Georgia, North Carolina, Virginia, and South Carolina. One would assume without this power, these unions are pretty weak and indeed that’s what we see. So are these the areas with the best educational outcomes? No. According to this ranking they are 40th, 30th, 34th, 9th and 38th respectively. Those rankings are all over the place, but it’s hard to see a compelling case in that data that defanging a union is a simple solution to our educational woes.
Similarly with the claim that raising the status of men will raise the birth rates, we can actually look at the countries that are worst on the gender equality index. Yemen is currently considered the worst country in the world for this, and here’s how their birthrate has gone in the last few decades:

Here’s Afghanistan, Syria and Iran:
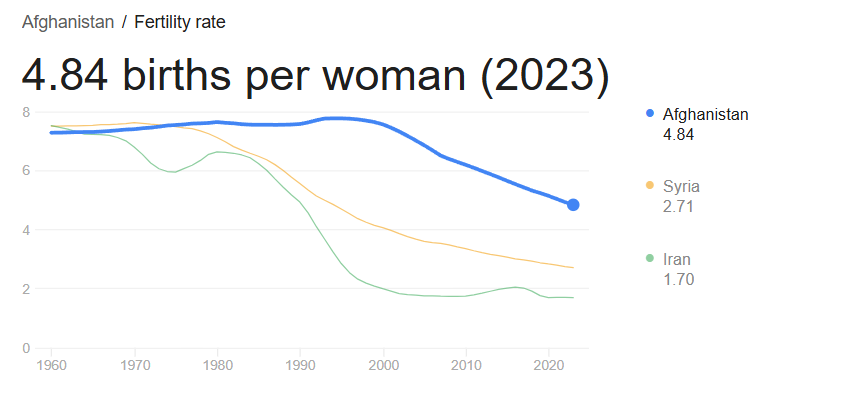
Now while these birthrates are higher than the US, it’s hard to miss that they are also falling. Even if one could overthrow the US and install Afghanistan style gender relations, it’s not clear that line would stop falling at all.
Now none of this is to say these hypotheses had no value, changes to unions or to male status might actually help the intended issues, but it’s important to be aware of their limitations from the jump. In both of these tweets these solutions were presented as clear and obvious with no caveats, but a quick look at real world data suggests they are not going to be silver bullets. For example, you say that Afghanistan is confounded by the unrest there, but how do you suggest you boost male status more effectively than the Taliban with less unrest? What damage are you suggesting unions are doing outside of their collective bargaining? Whatever your hypothesis is, let’s find a place that’s already doing it and see if it worked. If a strong effect doesn’t jump out at you, you have to temper your expectations.
We see this all over the place too, to the point where it’s a good first test for any hypothesis you have. Do you think people aren’t having babies because we don’t have a generous social safety net, free daycare or ample maternity leave? Let’s find some countries that have those things already:

Uh oh, that’s lower than the US. Again, maybe those things will help, but they clearly can’t be the full problem.
The Assistant Village Idiot recent put up a post about the belief by RFK Jr and others that psychiatric meds. The countries with the top anti-depressant consumption are Belgium, Greece, Spain, Iceland and Canada. These countries don’t come anywhere near the US for public mass shootings. We have 8-9 times Canada’s population and 27 times the number of public mass shootings. So we now have to explain why these medications would have a large impact in one country but not another. It’s possible! But it does involve invoking a bunch of other factors not part of the original statement.
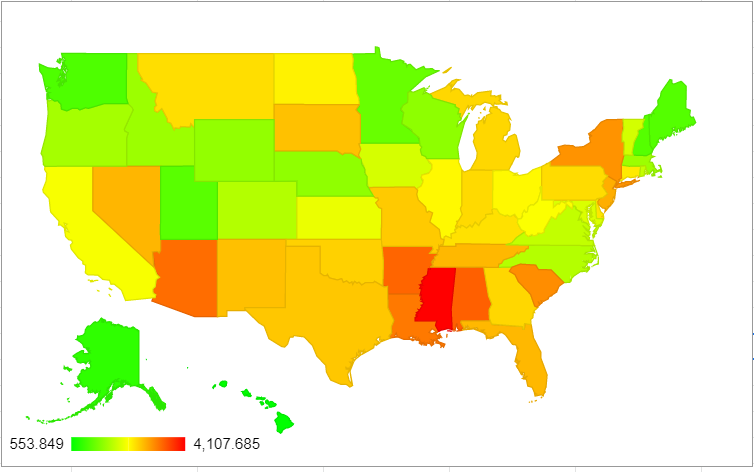
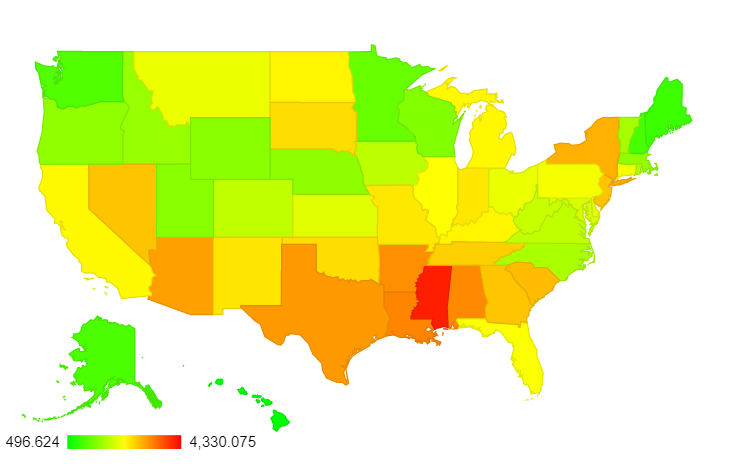
Got time for one more example? I’ve spent the past 2+ years hearing that my state (Massachusetts) had a super corrupt police force and an aggressive justice system based on one high profile case that happened in my town. It might surprise you to hear then that Massachusetts actually has the lowest incarceration rate in the country. We incarcerate 241 people per 100,000 residents. I’ve had to talk about this with people from Virginia (679 per 100k), Alaska (744 per 100k) and Illinois (433 per 100k). None of them were aware how high their incarceration rates were, comparatively speaking. Can we come up with a story where Massachusetts has an incredibly corrupt police force and aggressive justice system that only incarcerates people at a fraction of the rate of other states? Maybe, but it’s challenging. Add in the fact that we are bottom 5 for police involved killings, and your job gets even harder.
Like I said, state and country level data may not entirely disprove a hypothesis, but it does give a good first glance in to how compelling your case is. When I’ve pointed this out to people in various situations in real life, the first response I often get is “oh well of course there are other factors”. But normally we started this whole conversation because they made a statement that there was just one compelling factor. We can certainly back off to “it’s a bunch of things”, but that’s not typically where the conversation started. I understand in the social media age declarative statements are king, but state and country comparisons are pretty good at moderating conversations rather rapidly. Highly recommended.