This past week a reader contacted me to ask what I thought of a recent press release about a poll commissioned by GLAAD for their “Accelerating Acceptance” report. The report struck me as pretty interesting because the headlines mentioned that in 2017 there was a 4 point drop in LGBT acceptance, and I had actually just been discussing a Pew poll that showed a 7 point jump in the support for gay marriage in 2017.
I was intrigued by this discrepancy, so I decided to take a look at the report (site link here, PDF here), particularly since a few of the articles I read about the whole things seemed a little confused about what it actually said. Here are 5 things I found out:
- The GLAAD report bases comfort/acceptance on reaction to seven different scenarios In order to figure out an overall category for each person, respondents were asked how comfortable they’d feel with seven different scenarios. The scenarios were things like “seeing a same sex couple holding hands” or “my child being assigned an LGBT teacher”. Interestingly, respondents were most likely to say they’d be uncomfortable if they found out their child was going to have a lesson in school on LGBT history (37%), and they were least likely to say they’d be uncomfortable if an LGBT person was at their place of worship (24%).
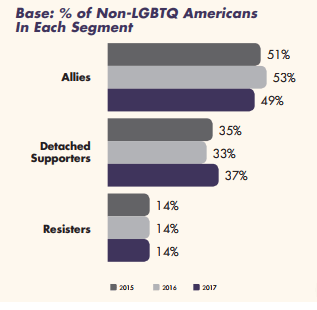
- The answers to those questions were used to assign people to a category Three different categories were assigned to people based on the responses they gave to the previous seven questions. “Allies” were respondents who said they’d be comfortable in all 7 situations. “Resisters” were those who said they’d be uncomfortable in all 7 situations. “Detached supporters” were those whose answers varied depending on the situation.
- It’s the “detached supporter” category that gained people this year. So this is where things got interesting. Every single question I mentioned in #1 saw an increase in the “uncomfortables” this year, all by 2-3%. While that’s right at the margin of error for a survey this size (about 2,000 people), the fact that every single one went up by a similar amount give some credence to the idea that it’s an uptick. To compound that point, this was not driven by an uptick of people responding they were uncomfortable in every situation, but actually more people saying they were uncomfortable in some situations but not others:
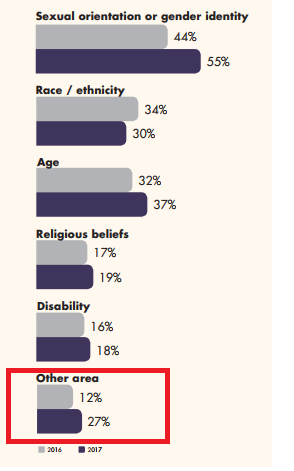
- The percent of gay people reporting discrimination has gone up quite a bit. Given the headlines, you’d think the biggest finding of this study would be the drop in the number of allies for LGBT people, but I actually thought the most striking finding was the number of LGBT people who said they had experienced discrimination. That went from 44% in 2016 to 55% in 2017, which was a bigger jump than other groups:
 That red box there is the only question I ended up with. Why is the 27% so small? Given that I saw no other axis/scale issues in the report, I wondered if that was a typo. Not the biggest deal, but curiosity inducing nonetheless.
 - Support for equal rights stayed steady For all the other findings, it was interesting to note that 79% of people continue to say they support equal rights for LGBT people. This number has not changed.

So overall, what’s going on here? Why is support for gay marriage going up, support for equal rights unchanged, but discrimination reports going up and individual comfort going down? I have a few thoughts.
First, for the overall “comfort” numbers, it is possible that this is just a general margin of error blip. The GLAAD survey only has 4 years of data, so it’s possible that this is an uptick with no trend attached. Pew Research has been tracking attitudes about gay marriage for almost 20 years, and they show a few years where a data point reversed the trend, only to change the next year. A perfectly linear trend is unlikely.
Second, in a tense political year, it is possible that different types of people pick up the phone to answer survey questions. If people are reporting similar or increased levels of support for concrete things (like legal rights) but slightly lower levels of comfort around people themselves, that may be a reflection of the polarized nature of many of our current political discussions. I know my political views haven’t changed much in the past 18 months, but my level of comfort around quite a few people I know has.
Third, there very well could be a change in attitudes going on here. One data point does not make a trend, but every trend starts with a data point. I’d particularly be interested in drilling in to those discrimination numbers to see what types of discrimination were on the uptick. Additionally, the summary report mentions that they’ve changed some of the wording (back in 2016) to make it clearer that they were asking about both LGB and T folks, which makes me wonder if the discrimination is different between those two groups. I wasn’t clear from the summary if they had separate answers for each or if they just mentioned each group specifically, so I could be wrong about what data they have here.
Regardless, the survey for next year should shed some light on the topic.

I am always curious what people mean by “reporting discrimination.” If I saw it, would I call it discrimination? Did it happen to you, did you see it, or did you hear about it? I don’t like watering down for a couple of reasons, including our reduced ability to come down hard on real malefactors.
LikeLike
Make too many mountains out of molehills and people will eventually mistake genuine mountains for molehills.
Similarly, the disapproval-of-homosexuality-equals-malice-towards-homosexuals false dilemma made me initially skeptical when Westboro “Baptist” “Church” first came to town, on the same crying-wolf principle.
LikeLike