With all the talk about Supreme Court nominations going on, I thought I’d take this opportunity to revisit a post I did back in 2012 about the level of agreement between Supreme Court Justices. I wrote the post because there seemed to be a perception that the Supreme Court was deeply divided, when the reality is that the most common outcome is a 9-0 decision. I got my data from the very cool SCOTUSblog Stat Pack, and they’ve kept putting them out every year since I posted. They now have 7 years worth of data, so I decided to make a graph of how often the Justices agree each term:
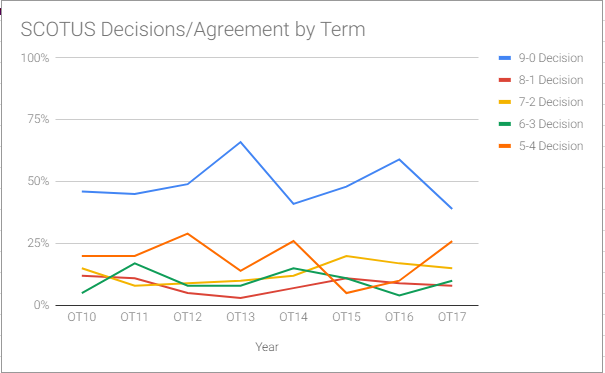
As you can see, the unanimous decision is still the most common outcome, with the 8-1 decision generally being the least common.
Back in 2012 (at the end of OT11), I mentioned that Roberts and Kennedy were the most likely to vote with the majority. Per the stats, they still are. At the time, Ginsberg was the most likely to dissent, now it’s Sotomayor.
The justices most likely to agree are Ginsberg/Sotomayor and Alito/Thomas, and the justices least likely to agree are basically the same, but with the partners swapped. Even the justices who agreed the least agreed 50% of the time on disputed cases. When you add in that half of all cases are unanimous, that means our most dissimilar justices agree 75% of the time.
To note on the above stats: SCOTUSblog breaks this down by both all cases and non-unanimous cases, and it basically doesn’t change. Focusing on just 5-4 cases changes things a bit, but that’s mostly because there’s so few of them.
They also did a round up on just 5-4 cases, and the influence Kennedy had over the years. Here’s the graphs they put out:

I’ll be interested to see who the next Justice is, and if the way the cases are decided change substantially. In evaluating the impact of any change though, we have to have a sense of what the baseline is. Thanks to SCOTUSblog for making that easier.
