There’s been a couple graphs trending on Twitter this week, and a couple of people have made sure to pass them on to me (thank you!). Both of them are trends over time for two of the hottest topics you can discuss: sex and religion.
The first was this one from the Washington Post, and shows the percentage of people not having sex is steadily increasing. The most stunning chart was this one: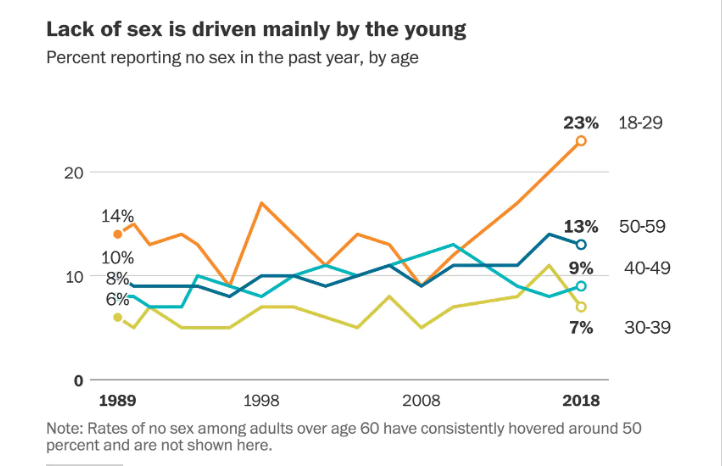
Of course your eyes immediately go to the right of the chart. It’s rather stunning that the percent of those not having sex in their 20s is twice as high as those not having sex in their 50s. A lot has been written about that right part of the graph and the sudden change in 2008 when the economy crashed/iPhone debuted, but I’ll admit the sudden dip and jump around 1998 caught my eye. What happened?
Well, as someone in their teens at that time, I have a guess. That was right when the Bill Clinton impeachment hearing was happening, and there was a large national debate about oral sex, and whether that counted as sex. Is it possible that having the definition so nationally debated changed the way young people answered the question temporarily? I may be wildly off on that, but it’s certainly an odd hiccup.
Next up, the latest GCS data shows that those saying they have no religious affiliation has surpassed those saying they are Evangelical in the US:

This is the first time “no religion” has surpassed all the other groupings, though to be fair 4 of those are just different groups of Christians.
As I looked at this graph, I was interested in how relatively stable Black Protestant has been….until I saw 1970. Did they really have about 14% of the population then suddenly drop to 8 or 9% then stay there for almost 5 decades? That seems unlikely.
I couldn’t figure out what happened there until I realized that 1970 appears to be the year Evangelicalism started to spike. I couldn’t find any specifics, but I am guessing that there was some reshuffling around what denominations were considered “Black Protestant” and which were considered “Evangelical”. When I did my post on religious classifications a few months ago, I noted that churches with “Baptist” in the name could be counted as Evangelical, Black Protestant or Mainline. My guess is it took a bit to get that sorted out on the GCS.
Anyway, no idea if I’m right on either of these theories, but I like to look at parts of the graphs that don’t get all the attention. Sometimes you can get interesting insights in to the data gathering process by looking at the parts that aren’t under scrutiny.
