Alright folks! It’s been a good summer but it went by too quickly and I’m realizing it has yet again been too long since I’ve posted an update. And this is still a pretty good update! When I posted for 6/1, we were at 1.125 million excess deaths. Now 3 months later we are at 1.18 million excess deaths. That’s is not bad at all!
We also confirmed that from around Feb-April country-wide we actually had no excess mortality at all, the first time we’ve been there for that long since the pandemic hit. Pretty good! So how does this look on a state level? Let’s see!
Excess Mortality Above Average
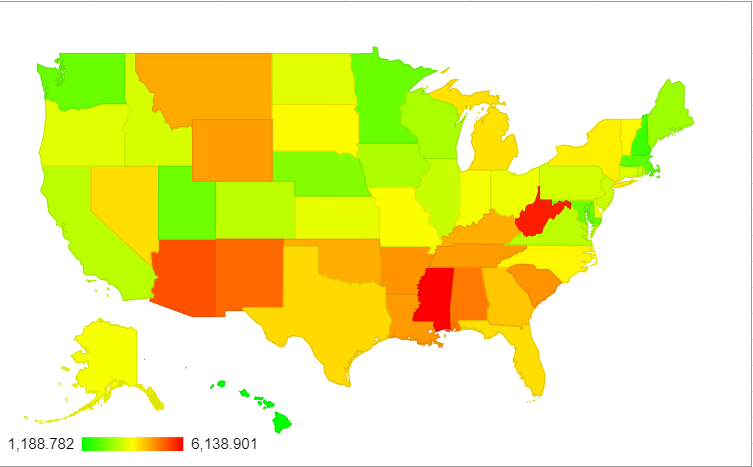
First up, the map. When I posted on 6/19, the range at the bottom was 1047-5823 deaths/million residents. Now it’s 1188-6139 deaths/million.

| State | Total Excess Mortality per million 2/1/20-9/1/22 | Change from 6/1/22 | Change in Rank |
| Mississippi | 6139 | 316 | 0 |
| West Virginia | 5856 | 234 | 0 |
| Arizona | 5353 | 200 | 0 |
| New Mexico | 5115 | 267 | 0 |
| Alabama | 4979 | 138 | 0 |
| South Carolina | 4708 | 421 | +4 |
| Arkansas | 4704 | 237 | +1 |
| Louisiana | 4651 | 145 | -2 |
| Tennessee | 4622 | 142 | -2 |
| Wyoming | 4610 | 257 | -1 |
Not a lot of change in rank going on! I took a look and out of the 52 regions listed (50 states + Puerto Rico and DC), 40 were within +/- 2 spots of where they were 3 months ago. So basically we are no longer seeing the strong swings we saw before, it seems like things have settled in to somewhat of a pattern
This raises an interesting point Henry Willmore raised to me a few weeks ago: how well correlated are vaccination rates and things like obesity by state? And if we can get both of those teased out, how much excess mortality seems to be explained by both? I had looked at obesity vs excess mortality about a year ago, but it seems like a good time to look at it again, huh? Let’s go!
Excess Mortality, Obesity and Vaccination
So first up, when I looked at state level obesity rates vs excess mortality a year ago, the correlation was pretty weak. Some high obesity states (like Alaska) still had low excess mortality then, so it wasn’t clear how much this was impacting things. Now the correlation is much higher. Here are the graphs of obesity rate and vaccination rate next to each other. To save you the math, correlation for obesity vs excess mortality is r=.57 and for vaccination rate vs excess mortality it’s r=-.63. Vaccination rates by state pulled from here, obesity rates pulled from here.

So how well correlated are obesity and vaccination rates with each other? Even more strongly correlated than either are with excess mortality, r = -.71:

So can we predict approximate excess mortality using obesity rates and vaccination rates? Well, setting up a model here is a little tricky because our two independent variables are correlated (multicollinearity), but we should end up with a model that looks something like this:
State level excess mortality/million = 5045 + 5876(% Obese) – 5016(% Fully vaccinated)
So a percent drop in obesity is better than a percent increase in vaccination (58 vs 50), though of course vaccination rates have changed quite a bit since 2/1/20.
Testing the model out for MA, we get:
=5045+5876(.24)+5016(.81)
=5045+1410-4062
=2393
Which is not too far from our actual total of 2063!
Now this model is only moderately well fit. Some states outperformed this by quite a bit: New Hampshire, Hawaii, Nebraska, Iowa, Utah, and Minnesota all had far fewer deaths than this model would predict. On the other end, New Mexico, Arizona, West Virginia, Mississippi, Vermont and New York all had quite a bit more excess mortality than this model would predict. I don’t have a lot of theories for what these particular states have going on, but it is interesting to note that in general those two factors do a moderately job at predicting all cause excess mortality.
Alright, that’s all I have for now! Stay safe our there.