Back Pain and Yoga

So the irritation of the week is back pain.  I have a slight spinal deformity and gosh does that thing flair up sometimes.  I was looking around for some good papers to help address this issue, when I stumbled across this one that compared yoga, exercise, and a self care book.  It’s called Comparing Yoga, Exercise, and a Self-Care Book for Chronic Low Back Pain A Randomized, Controlled Trial  by Karen J. Sherman, PhD, MPH; Daniel C. Cherkin, PhD; Janet Erro, RN, MN, PNP; Diana L. Miglioretti, PhD; and Richard A. Deyo, MD, MPH.  Here’s the sketchnote:07jul15v2

Some thoughts:

  1. It’s pretty unsurprisingly both exercise and yoga outperformed the book.  Both were active interventions with some participation required.  Interventions like that tend to do better.
  2. The design of this study had a lot of attention to detail.  They were very careful to make the exercise as attractive as the yoga by having a physical therapist design a special program uniquely for the study.  They wanted to make sure that both the yoga and the exercise were novel enough that people would be interested equally in both.  I’ve seen other studies skip this step or have one clearly more interesting option, so I was happy to see they controlled for it.
  3. It’s interesting to think of the real world implications of point #2.  It is likely much easier to find a yoga class than it is to find a custom back pain exercise class.  OTOH, some people may like going to a physical therapist better than doing yoga, and that’s probably close to the same thing.

Ultimately, if it looks intriguing, that’s probably enough to help make a difference.


Rock, Paper, Crayon

Recently in a conversation with a friend of mine, I mentioned a paper I had read that asserted that we are more attracted to potential partners who look like us1.  I couldn’t remember all of the details, so a googling I went.  Before I found the actual paper, I found an article about it that contained the following sentence:

For the study, photographs of real-life couples were also studied and analyzed by the researchers with at least one child, to determine if these actually influenced partner choices.

There’s a sentence that leaves you with an amusing mental image.  Did the researchers have to have at least one child?  Did a child help with the analysis? Who is this child and why are they involved so specifically?

When I found the paper, I confirmed that in fact it was the couples being analyzed who had at least one child….but I still like my mental image of a kid with a crayon, marking up all the photos with his observations on face structure.
1. Because it would annoy the crap out of me to read a reference like that with no link to the original paper, here you go.

No One Asked Me: Farting in Public

I’m a guy and I try my very best to not fart at all because if I did in around anyone, I’d be so humiliated I’d probably never come to school again or never go where I did again. Especially if someone was close and may have heard. Is it unhealthy to hold in farts? Do you guys think it feels good to fart? I’m sorry, I know it’s a disgusting question but I’m just curious on what you guys think of it.

-Anonymous Teen

Found at Yahoo Answers

Alright AT,  I’m gonna skip over some of the touchy feely does-farting-feel-good stuff here, and go straight for the crux of the matter: it’s not going to hurt your health to hold in farts, but it might give you a few cramps and be kind of uncomfortable.

I’m not letting you off that easily though, because I’m a little concerned about your anxiety level here. No one’s saying you have to be Peter Griffin, but  I’m not sure I’ve ever heard of someone being this concerned about farting in public1.  Would it make you feel better if we ran some numbers here?  That always calms me down.

The simplest way of drawing out your fears is through a Venn diagram, like this:

02Jul15blog

My circles aren’t great. I need a compass.

In other words, you’re not scared of farting, you’re not scare of being in public, you’re scared of farting AND being in public at the same time.

So the first thing we have to do is to assess the scope of the problem aka the size of the circles.  For the purposes of this exercise, I’m going to assume that other than the anxiety you’re  healthy.  If you read anything here that makes you think you are farting more often or with a worse smell than what’s normal, you may want to talk to your doctor.  Alright, let’s start with the farting.   Now the average person is going to fart about 10-20 times in a 24 hour period, with at least some of those coming at night.  In this study, the median number during waking hours was 8, so lets start with that.  This works out to about one fart for every two hours of wakefulness.  However, that same study told us that it’s very likely this isn’t spread out evenly.  You’re more likely to fart in the hour after you eat.  So what would happen if we drew out a little table of what a hypothetical day of farting might looking like?  Well, in stats we call this a probability density function or PDF, and we can draw it like this:

All the values should be multiplied by 8, if that's the average we're rolling with here.

All the values should be multiplied by 8 to get the total per hour, if that’s the average we’re rolling with here.

If you’d like some better data, you can track yourself for a few days and see if you have any unique patterns.  In a case study about a terribly unfortunate man who was farting 30-130 times a day, his journal looked like this2.  Now this may be segmented out a little too much to be useful, so lets collapse that down a bit:

02Jul15pic3

Red = Danger danger Will Robinson

So if you follow this schedule, we’re looking at 6 or 7 farts in public.

Now a few things jump out at me here.  The first is that spike in the morning could definitely be moved a bit if you ate breakfast earlier, causing that first wave to happen before you get to school.  Also, there’s some evidence we could mitigate that spike after lunch if you started trying to avoid having gas producing foods.  Another tip from that list is to avoid gum or soda all day, as those can both lead to farting3.  If you want to get even better, you could make sure you wander off by yourself for a bit right after dinner.

Making those changes, we can shift the brackets in a bit, and we may be down to dealing with only 4 or 5, most right after lunch. Nice!  Now you’re dealing with a lot less stress, and you have some idea about when you might need to run to the bathroom or use one of these tricks to hide the sound or these pads to hide the smell.

Good luck.


1. Not gonna name names or anything, but there’s a few people in my life I might like you to talk to when we’re done here.
2. Spoiler alert: don’t go to his house around 8am.
3. The fact that you might be able to control this a bit is good news for you, but it’s why I couldn’t assume independence and thus use a Poisson distribution which sucks because I LOVE POISSON DISTRIBUTIONS.


R&C: A Tale of Two Bowel Preps

So last week I had the distinct, uh, pleasure of having my first colonoscopy.  To answer your questions:

  1. Yes, I’m too young for that
  2. I had to get one because of family risk factors, that I’m irrationally annoyed about.
  3. Yes, talking about it could be considered TMI

With that out of the way, I’m at least going to talk about #3 there.  Colonoscopies are weird and uncomfortable to talk about yes, but colorectal cancer is the 2nd deadliest cancer (behind only lung cancer) in the US, and it just doesn’t have to be like that.  It’s pretty treatable if caught early, and removing polyps can prevent it all together.  Despite this, many people still skip or delay their colonoscopies because they’re embarrassed.  More info here.  By talking about it, I’m hoping to do my small part in normalizing the experience.  If we all talk/laugh/whatever about it, maybe more people will go.

Anyway, if you go to get a colonoscopy, nearly everyone will tell you the preparation is the worst part.  You have to do a clear liquids diet for a day, and drink whole bunch of stuff to clean you out.  The subject of my paper this week is what that drink actually is, and what the alternatives are.

When I told people I was going, a lot of people warned me about the drink.  When I got my instructions, I was interested to see that there was not special drink.  I was told to by an over the counter bottle of MiraLax and some Gatorade, mix them together, and to drink that.  Several people were rather surprised that this was an option, so I decided to look in to it.  I found this paper: Randomised clinical trial: MiraLAX vs. Golytely – a controlled study of efficacy and patient tolerability in bowel preparation for colonoscopy by B. K. Enestvedt,M. B. Fennerty and G. M. Eisen.  Success!  This paper covered exactly what the two drinks were, and why you might pick one over the other.

Interesting side note:  The third drink mentioned (currently advised against by the FDA) causes a severe reaction in some people.  My boss was apparently one of those people, and her first colonoscopy was the closest she ever felt to death.  That was a really fun story to hear 3 days before going for mine.

Anyway, here’s the paper30Jun15

Interesting huh?  Before I found this paper, I had actually asked the nurses at my center why they used the Gatorade mix instead of the Golytely.  They told me that at least at their center, they had been struggling with patient complaints about the Golytely and lower compliance, and effect not really seen in this study. That matched my anecdotal experience of friends and family wondering why they hadn’t been told their was an alternative. My center also uses a slightly different prep scheme than was used in this study, which the study author suggest could make it more effective (for this study the Golytely prep and the Miralax prep were identical in terms of timing).

Regardless, my prep appeared to have worked, so that’s nice.  I’ll be back in 3 years or so, she said ruefully.

No One Asked Me: Yesterday’s Weather

“I always dress for yesterday’s weather.”
-my brother

Okay so that’s not really a question.  In my defense though, my brother’s got a philosophy degree, which means most of what he says is an attempt to provoke a reaction, make a grand statement about life, explain his more questionable dating choices, or to get more attention, though not necessarily in that order.  Anyway, he posed this statement to me recently, then arched his eyebrow.  It’s possible I was supposed to take that as an opportunity to extrapolate some deeper meaning about his relationship with his ex-girlfriend, but instead I got curious.  If you really did always dress for yesterday’s weather, how often would this be okay?

It turns out this is one of those interesting stats questions that you can sort of come up with an answer for, but you have to make all sorts of assumptions to get there.   I did some poking around, and here are the parameters I figured I’d have to work with:

  1. You are perfectly rational.  Now this may not be a great assumption1, but it’s one we have to go with if we hope to get anywhere.  The problem with this is that people, especially those of us in northern climates, tend to start rebelling against winter every year. It’s a pretty well documented phenomena that some time around March/April people in northern climates just say “screw it” to the coat/gloves/scarf thing.  I don’t totally know how to take this in to account, but it’s something to keep in mind.
  2. You are like me.  It appears at least some types of cold/heat perception are pretty heritable, so when in doubt I assumed you’d act exactly like I do.  Hey, it worked in middle school.
  3. You modify clothes approximately every ten degrees (Fahrenheit).  This one was actually remarkably hard to find data about.  The problem is that apparently our bodies make lousy thermometers, and we have a remarkable spread of preferences.  The most consistent breakdowns I could find were actually on running or other outdoor sport sites, and they seem to support my “ever 10 degrees” hypothesis.  Apparently that’s where you can measure an impact on performance.
  4. You live in Boston. Yeah, you don’t.  Never have actually.  But I do, and the data’s actually stored for a while.
  5. Being stuck in the rain without an umbrella will bug you, but having an umbrella you don’t need won’t.  Umbrellas are like towels.  Always good to carry one.
  6. You don’t use an umbrella or other rain gear if it’s snowing.  Because snow’s not mean like that and you already have a jacket on and you’d look silly, that’s why.


Alright, with those out of the way, lets talk data.  I found a handy site called Weather Underground that actually keeps detailed archives of the weather.  From there I pulled all the data for Boston from Jan 1st, 2010 to June 22nd, 20152.  After that I measured a few things:

  1. How often the daily high temperature changed from one day to the next by more than 10 degrees in either direction
  2. How often the average daily temperature changed from one day to the next by more than 10 degrees in either direction
  3. How often a clear day was followed by a rainy day.

Basically if any of those three changes occurred, I assumed that you ended up dressed incorrectly.  It’s not perfect…the rain could have happened overnight for example, but it’ll get us in the ballpark.  I knocked off a few values because of fluctuations that fell in to either of the extremes (ie under 25 degrees or over 80 degrees).  Essentially if the day before was 85 and the next day was 96, I assumed you still dressed the same way.   At that point we normally resort to things like swimming or staying inside as opposed to clothing changes.  I did not account for changes in the daily low, as those usually happen at night, and the average picks up those changes. Based on all of this you ended up about 65.5% accurate.  Not bad!

Okay, so what went wrong on the other days?  Well, of the days you got wrong, here’s what tripped you up:

Temperature Changed: 49%

It Rained: 38%3

It Rained AND the Temperature Changed: 13%

Cool!   Now what if we wanted to know your luckiest month?  Well I have that too!

Month % of days you are properly dressed
August 75%
February 71%
July 70%
September 70%
October 68%
January 66%
November 66%
December 65%
June 63%
April 60%
May 60%
March 59%

So you’re actually headed in to a pretty good stretch here!  July’s almost here and August is really your month. At the very least you have some time to kill before March.  Use it wisely, and feel free to put this data on your LinkedIn/Facebook/Match.com profile.  It’s sure to impress.

You’re welcome.


1. At least that’s what mom said when I mentioned it to her.
2. Hey, happy birthday!
3. Interestingly, that means if you took my advice and always carried an umbrella, your accuracy would go up to almost 78%.  Things to consider.

R&C: Drinking and Work

It’s been a lovely couple of weeks (months….almost a year really) at work, and I’ve been starting to ponder the effect of your job on your drinking.  Or the effect of drinking on your job.  Sometimes both at the same time.  I digress.

This week, I picked a paper called Job Strain and Alcohol Intake, A Collaborative Meta-Analysis which looked at the literature to see if high stress jobs were associated with higher drinking.

23Jun15blog


One of the most interesting parts of this paper was how they defined a “stressful job”….basically it was demanding jobs where you had very little control over your work.  By this metric, my job is not actually that stressful.  I’m not sure control inoculates you against stress the way they think it does, but I suppose it’s better than the alternatives.

Supplementary Calculations: June 18th, 2015

These are the supplementary calculations for this post.  Read that first or you’ll be confused.

Okay, you clicked.  Wow.  Good for you.  Alright….so to solve this problem we have to do a few different things:

1. First, we have to get our two distributions.  Normal distributions are noted using this notation N(average, variance).  Since the original paper gave standard deviation for each, I had to square it to get the variance.  Thus the two below, one for men, one for women.

2. Next we use these two distributions to make a new one that represents the distribution of the difference between the two distributions.  The nifty thing about normal distributions is this is weirdly easy to do.  We just subtract the averages to get the new average, then add the variances.  Not all transformations are this easy, but a simple one like this is nice and simple.

3. We use my Yugo/Cumberbatch equation!  Yay!  Basically what we are doing here is turning our newly acquired normal distribution and rejiggering it to make it in to the little black dress of distributions….the N(0, 1) distribution.  Every stats book you will ever find has probabilities for this distribution, so it’s the gold standard and makes our lives easier to boot.  When we do our math, we get that we’re looking for anything over .95.  Our handy dandy book tells me that’s .17 or a 17% chance.
16Jun15blog3

No One Asked Me: Height Differences

Do you think the height difference is too much if a girl is 4’11 and a guy is 5’8?
Just wondering what other people’s thoughts are… My friend thinks it’s too much of a difference.
-Anonymous

Found on Yahoo! Answers

Okay Anonymous, let’s talk this out.  There’s a few different ways of looking at this type of problem, and figuring out how much of a height difference is “too much”.  The first thing you should know is that height for males and females follow two different, but similar, normal (gaussian) distributions.   They look like this:

Aw cute, they're holding hands...er, tails!

Aw cute, they’re holding hands…er, tails!

That’s what it looks like when two normal distributions are similar in shape but have different averages.  For the most part they stay on their own sides, but there’s some overlap.  Now, some people1 will tell you this is a good example of a bimodal distribution, but there’s some controversy about that2, so tread lightly, Anonymous. Those same people will also tell you this means it looks like a camel….

This camel would like to point out that comparisons to him are ALSO a potentially inaccurate analogy and yet no one's writing papers about HIM.  He has feelings too you know.

This camel would like to point out that comparisons to his humps are ALSO a potentially inaccurate analogy and yet no one’s writing papers about that issue. He has feelings too you know.

….maybe you should avoid this analogy too. Regardless of what we call it or how we describe it, you’ve noticed this before and you know what it means – most women will wind up with men who are taller than them.  Quite handily for your question, people love to track these distributions as much as Stats 101 profs love to use them as examples, so we have a nice data set from 2007-2008 here.  We’ll work off of that.  I like this data set because it’s kind of cute, and height is measured rather than self reported, which means it’s likely more accurate than a lot of the other more shifty looking data sets out there.

Now Anon (can I call you Anon?), I’m going to assume from your question that you’re on the young side.  I don’t know if you’re pre-pubescent or post, but just know that if either of you are younger than 15 or 16, there’s still a shot one of you could grow a bit more.  For the purposes of this exercise though, let’s assume you’re both in the 20-29 range.  While technically adult height ranges could be anywhere from 21 inches to 8’3”, we know that in reality over 99%3 of adult  men you meet will be between 5’3” and 6’4”, and 99% of adult women will be between 4’10” and 6′ tall4.

Since you didn’t give your gender, we’re going to look at this from two different angles.

If you are the girl:

If you’re our 4’11” girl, you may not want to go ruling out a 9 inch height difference so quickly.  Only 33.1% of men are shorter than this, so it’s actually more like than not that you’ll meet a guy whose even taller than 5’8”….and thus more than 9” taller than you.

If you are the guy:

Well now the story kind of changes.  If you’re our guy here, your chances of meeting a girl shorter than 4’11” are actually pretty small….only 2.6% of women are shorter than this.  Thus nearly every woman you meet will be less than 9 inches taller than you.  You’ll actually meet women taller than you 5 times as often as you’ll meet a woman shorter than 4’11”.

If you just want to fit in:

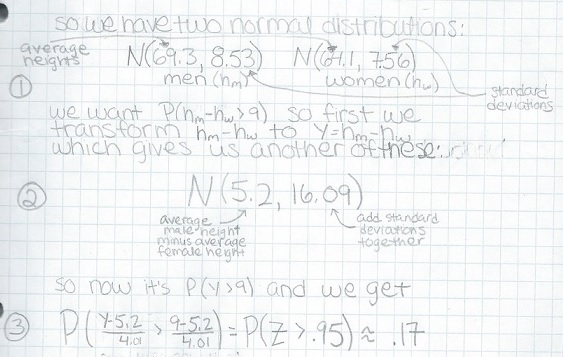
Alright, so now that we told you your chances, lets take this from another angle.  What happens if you are not concerned about you personally, so much as you’re concerned about everyone else.  How often do people, in general, wind up with someone 9 inches taller than them or more?  Well, for that we have to use some slightly different data.  When I mentioned the bimodal controversy up there a while back, I linked to another nifty data set that gave me some more information:  mean and standard deviation of male and female heights.  Those are cool because now I can blatantly exploit their good nature to calculate how likely it is that we will find a woman 9″ shorter than her male partner.  To do this we….you know what?  You are not going to be interested.  If you want to see the calculations, go here.  I want to show you on of the equation I used though, because it’s initially kind of funny looking but when you see it in action you find yourself oddly attracted to it, like a Yugo or Benedict Cumberbatch:

The Yugo literally looks like a bad drawing of a car came to life

The Yugo literally looks like a bad drawing of a car came to life

Take that baby out for a spin and it tells you that there’s a 17% chance that he’s more than 9 inches taller than her.

BUT YOU’VE BEEN LIED TO, BY ME AND POSSIBLY BY EVERYONE:

Alright Anon, I gotta come clean.  I’ve been lying to you, and I’m sorry.  In my haste to impress you, I totally made a few things up that I shouldn’t have.  It’s hard for me to say this, but here we go: I never should have presumed that any of this was random. I was trying to make life easier on myself by making some assumptions, but I can’t do that to you now that we’re friends and all.  All the calculations I just did presume that men and women just get thrown together without anyone ever thinking anything or having preferences.  That’s completely not true and you and I both know it.  People like what they like,  and what they like frequently includes height preferences, at least enough to mess with my calculations.  As a little bit bonus of life advice, any time anyone shows you a statistic, it’s a good idea to try and figure out what assumptions they made on their way to getting it.  Everyone makes assumptions to get their math to be a little easier5, but sometimes those assumptions make our results way less useful.

So what’s the real story if we don’t presume everything’s random? Well, Fivethirtyeight.com did some good math on this a few months ago while answering a question about how often in real life a man would be shorter than his partner here, and they linked to an interesting study that suggested in the real world, 9 inch (or close) height differences would occur in 30% of couples. That’s even more than the 17% we came up with up earlier, and a few more calculat.  So you’re not alone Anon, not even close.  Everything else being equal, the height difference shouldn’t be a problem, and it definitely won’t be that unusual.  In fact, given how common it is, you may want to consider that one of your friends has a crush on whoever you’ve got your eye on, and is trying to talk you out of it so they can have him/her to themselves.  I’m unimpressed with their advice here, and the math agrees with me.  Good luck and god speed you crazy kids you.


1. Up to and including every stats 101 prof ever.
2. This paper ends with one of the most amusing conclusions of all time. Essentially they conclude that a. male/female height distributions are not really technically bimodal but b. there’s no other good quick classroom demonstration they can think of to illustrate the concept and c. readers should think of one and tell them so we can stop using this
3. 99% sounds like a lot, but keep in mind that at least in the USA this leaves nearly 2.5 million adults outside of these ranges. 1% of a large number is a LOT.
4. Tangentially related bonus fact:Right around 5’7” we hit a kind of magical crossover place, where it’s equally likely that men and women will be that height.  Put another way, if I were to say something like “my cousin is 5’7””, and you were trying to guess my cousin’s gender based only on that statement, you’d have to guess completely at random.
5. If you think I’m bad, don’t even get me started on physicists.

R&C: I Have a Cold

It never fails, every time I work more than 9 days in a row I come down with a cold.  This latest run was no exception, and the worst part was I didn’t get a day off until day 13.  Let me tell you, it was a good time.

It’s been a tough couple of months at work, and it’s been ages since I had a real vacation.  This has not gone unnoticed, so the most common thing I heard last week from coworkers/friends/family/everyone was something along the lines of “I’m not surprised you got sick, you’ve been so stressed out!”. Naturally, I started to wonder how much validity there was to this statement, what the mechanism was, and how big the effect size might be, because that’s how I deal with things.  I wondered if stress in and of itself was a factor, or if it was really the unhealthy behaviors that came with stress.  Luckily for me, some researchers out of Carnegie Mellon were all ready with my answer in their paper Psychological Stress and Susceptibility to the Common Cold.  It’s a pretty good paper, so I sketchnoted it while still sick which is why I accidentally misspelled “susceptibility” in the title and gave my sick man 4 arms.  Ah well.

16Jun15blog


So overall, some good proof that the presence of stress can actually increase your cold risk.  My coworkers were right, and I’m taking some Nyquil and going to bed.  Goodnight everyone