Refugees and Resettlement

It’s always somewhat gratifying when I hear someone in my personal life change the way they speak about an issue because of my blogging. It’s even more gratifying when I get the sense they’ve actually internalized some of the ideas and aren’t just being careful because I’m around. This happened last weekend when my brother casually mentioned that he’d heard that the US actually resettled about a third of the world’s refugees. He mentioned that he wasn’t sure how that was possible since he knew the number of refugees the US took in was dropping, but he wondered if there was some meaning to “resettled” he was missing. As a thank you to him for being so conscientious about his adjectives, I figured I’d look in to the stats and definitions for him.

First, I have to admit it took me a few minutes to find anything on this, mostly because I thought he said the data came from “UNH”, which I took to mean the University of New Hampshire. Turns out he actually said the UNHCR, or the UN High Commissioner for Refugees. Oops.

When I finally found the right page, I was impressed to see that they actually have really wonderful resources defining all of what their terms mean. For refugees, the three solutions they work towards are voluntary repatriation (returning to their home country when it is more stable), resettlement (moving permanently to another country) or integration (becoming part of your host country).

It’s those last two that seemed to be causing the confusion (at least for me), but it made sense when I read it. A host country is the country the refugees initially go to when they flee their own country. Unsurprisingly, these are most often countries closer in proximity to them that will allow them to stay there. From their fact sheets, the top host countries are Turkey, Pakistan, Lebanon, Iran and Uganda: The refugees that stay in those countries aren’t considered “resettled”, because it’s considered temporary. The UNHCR works with those refugees to identify those who are most vulnerable (you cannot apply), and then submits their application. They don’t get to pick the country they go to. Unlike the host country, the countries that accept refugees through this program agree to give them permanent legal status in their country.

So does the US really accept a third of all resettled refugees cases? Yes, last year that was true. In other years it’s been even higher. I can’t embed it here, but this page has a really nifty graph of the total applications/departures each year, and you can filter it by resettlement country. In 2017 there were about 75,000 UNHCR applications for resettlement, the US took 26,000 of those.  In 2016 there were 163,000 applications, and the US took 108,000. Now I should mention that by “took” I mean took the application. Countries still do their own screening process before people are actually resettled.

Question 1, answered! Oh, did I mention there was a second question?

As we were talking about the plausibility of this stat, we raised the issue that we were constantly hearing about how many refugees countries like Germany were taking in. We were trying to figure out what category those people fell in to, and how they fit in to this picture.

As far as I can tell, the migrants making the headlines in Europe are either asylum seekers or economic migrants. Asylum seekers differ from resettled refugees in that resettled refugees are sent to a country under an agreement/discussion with the UNHCR and after a screening, and asylum seekers just show up and are screened after the fact. Since only 1% of the world’s refugees are ever resettled, the vast majority of refugee discussions are talking about asylum seekers. I won’t pontificate much more on the differences as that gets in to all sorts of legal issues, but I can say I had fun playing around with the graph generator on the UNHCR website. Here’s the number of resettled refugees France, Germany and the US have taken since 2003, and what countries they came from:

 

5 More Things About Fertility Rates

Normally when I write a blog post, it’s because some topic was rattling around in my head too much and I want to get it out of there. This works most of the time, and after hitting publish I tend to stop thinking as often about whatever it is I wrote about. Sometimes however, this works in reverse and my initial post sparks me and various readers/others in my life to keep talking about the topic. My last post on fertility rates was of the latter group, and I’ve spent the past week discussing it with people both online and in real life. The roundup below is 5 of the most interesting things that came out of those discussions:

  1. Male fertility is dropping I mentioned last week that while fertility rates are always counted in children/woman, we shouldn’t forget the role of men in the whole thing. To help prove that point, commenter Christopher B pointed me to an interesting article I hadn’t seen about dropping sperm counts in Western men. According to the meta-analysis cited, sperm counts have dropped 50-60% since about 1973. There wasn’t a particular reason cited, but the Assistant Village Idiot mentioned sleep deprivation, and the authors didn’t rule out chemical exposures or increasing obesity. I also found a paper that found that “After adjusting for female age, conception during a 12-month period was 30% less likely for men over age 40 years as compared with men younger than age 30 years”. This is almost certainly playing a role in dropping fertility rates, particularly if you approach it from the “why don’t people have 3 or more children as often anymore?” angle. If you struggle to have a first child, you may pay for infertility treatments, but very few people go through the time and expense of them for a third child. The biggest impact however, may be on my next topic…..
  2. Reducing unplanned pregnancies reduces fertility rates The sentiments “lower teen pregnancy rate” and it’s close cousin “reduce unintended pregnancies” are pretty non-controversial as far as public health goals go. While the methods proposed to meet these goals can be quite controversial (abortion, free birth control, abstinence only education, etc), most people actually agree on the end game. Thus when we look at the fertility rate and why it’s dropping, we have to consider that 45% of pregnancies in America are still considered “unintended”, with about 40% of those ending in an abortion. This got me wondering a few things. First, I wonder if the dropping sperm counts have actually impacted how frequently unplanned pregnancies occur. Teen pregnancy rates have been trending downward for quite some time, and one wonders if that’s been helped by things like dropping sperm counts. It’s probably not the whole reason, but it certainly seems unlikely to hurt.
  3. Our messages around teen and unplanned pregnancies may bleed over in to our thinking about planned pregnancies. One of the posts that kicked off all my thoughts on fertility rates was this one by the Assistant Village Idiot. I don’t know that I agreed with the example he gave, but the core thought of his post seems true: it is really really hard to discourage teens from having babies without saying things about how challenging kids are or how important it is that you have your ducks in a row before you have them. I mean, imagine that you find out that a 15 year old you know and care about is having unprotected sex with a partner. What do you say to them? Your first thoughts are almost certainly about how many opportunities they’ll be giving up and how much work kids are. This is the dominate message most kids receive until at least 18, longer if they’re college bound, and almost always including some time to figure yourself out. Even groups that don’t necessarily support the “figure yourself out” phase tend to have their own pressures. For example, in my Baptist high school, you definitely needed to find someone to marry first (that you wouldn’t divorce), and you needed to have enough money to make sure you never had to rely on welfare. The point here is not that any of this advice is wrong, but rather that it’s the dominant message for the first 10-15 years most people are biologically capable of having children, and people likely take them to heart for much longer than that.
  4. Kin influence One of the more interesting theories I read while reading up on fertility rates was the theory of “kin influence”. As I mentioned, it’s been noted that increased education drops fertility rates quite quickly. One proposed mechanism for this is that it’s not necessarily what education adds, but what it subtracts: 24-7 time around your family. The idea is that biologically, your family has a high motivation to encourage you to have kids, because this helps your families DNA continue. Educators and friends may care for you, but they don’t not have the same interest in encouraging you to have kids. Interestingly, even in the developed world, people who live closer/are closer emotionally to their family tend to have more children. Some of this is likely also related to resources…most people take advantage of grandma/grandpa babysitters before they look at other options. The paper didn’t mention it, but I have to wonder how this theory overlaps with the issues in #3. Parents tend to be some of the strongest voices telling teens not to get pregnant, which suggests that development doesn’t just shift the attitudes of those who might be having children, but the generation above them as well. When fertility rates fall rapidly in a country like Iran, is that all men and women of childbearing age deciding to have fewer children, or are their own parents there encouraging them to take advantage of more educational opportunities first?
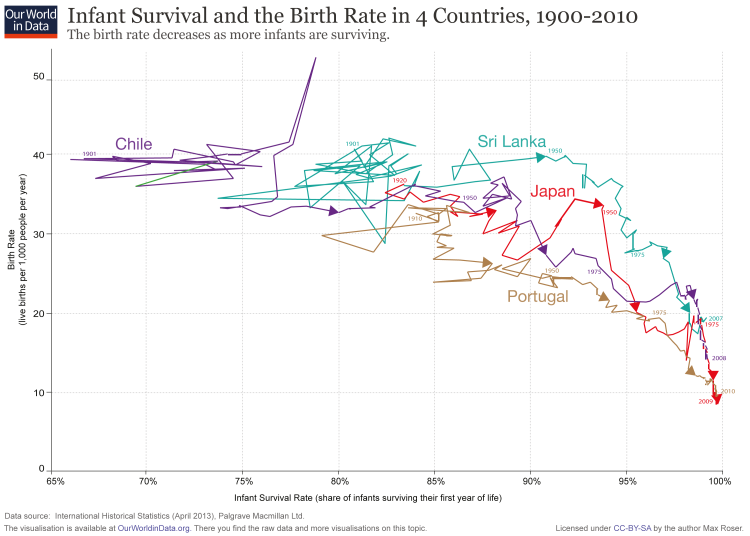
  5. Child mortality rates To end on a sad note, it’s terrible to realize that some of the very high fertility rates in the developing world may actually be driven by child mortality. While it’s hard to prove causality, it appears that everywhere child mortality drops, fertility rates drop with it. From Our World in Data:  This is a good reminder that countries with total fertility rates of 6 children/woman or more almost never result in families of 6 adult children, and that our drops in fertility rate aren’t always as dramatic as they sound. For example, in the year 1800 in the US, the fertility rate was nearly 7 children/woman, while today it is just under 2. However, if you factor child mortality in, the drop is much less dramatic: I don’t know exactly what to make of this, but I can speculate that if you have good confidence your children will live, you may plan more for each of their births. It also just reminds me how grateful I am to live in this time period.
Overall this has been an interesting discussion and I appreciate everyone’s comments!

5 Things About Fertility Rates

Birth order is a hot topic in my family. I’m the oldest of four, and for as long as I can remember I’ve been grousing that being the oldest child is a bad deal. Your parents try out all their bright shiny untested parenting theories on you, relaxing the rules for all the subsequent kids, you’re held responsible for everything, and generally it’s just not faaaaaaaaaaaaaaaaair. Of course all this extra pressure does have some upsides later in life, like an increased likelihood of being a CEO or President. Anyway, given how often I’ve brought this up over the years, my parents (a youngest-of-3 and middle-of-5, respectively) were quick to point me to this article about the disappearance of the middle child in the US. After reading this article and the AVIs post about birthrates earlier this week, I went on a bit of a Google-bender on the whole topic. I figured I’d do a roundup of the most interesting numbers I found.

A quick note before I get started: for ease-of-counting purposes, fertility rates and family sizes are normally measured by “number of kids per woman”. This makes the data less messy, since you don’t have to worry about controlling for people who have children with multiple partners. However, it does often make discussions of fertility rates sound as though women are having kids in a vacuum and that men have nothing to do with it. This is simply not true. Social and economic pressures that encourage women to have fewer kids are almost certainly impacting men as well, and the compounding effect can decrease birthrates quite quickly.  So basically while I’ll be making a lot of references to women below, that’s just a data thing, not a “this is how it actually works” thing. Also, I’m going to mostly stick to numbers here as opposed to speculate on causality, because that’s just how I roll.

Alright, with that out of the way, let’s get started!

  1. Birthrates are declining worldwide. It’s not surprising that most discussions of birthrates and family size in the US immediately start with a discussion of the factors in the US that could have led to falling birthrates. However, it’s important to realize that declining fertility rates is a global phenomena. Our World in Data shows that in 1950, the total fertility rate (TFR) for women everywhere was 5 children. In 2015, it was at 2.49. In that same time period, the US went from about 3 children per woman to 1.84.  This is notable because sometimes the explanations that are offered for declining birthrates in the US (like expensive daycare or lack of parental leave policies) don’t hold when you compare them to other countries. Sweden and Denmark are both known for having robust childcare/time off policies for parents, yet their fertility rates are identical to or lower than ours. Whatever it is that pushes birth rates lower, it seems to have a pretty cross cultural impact.
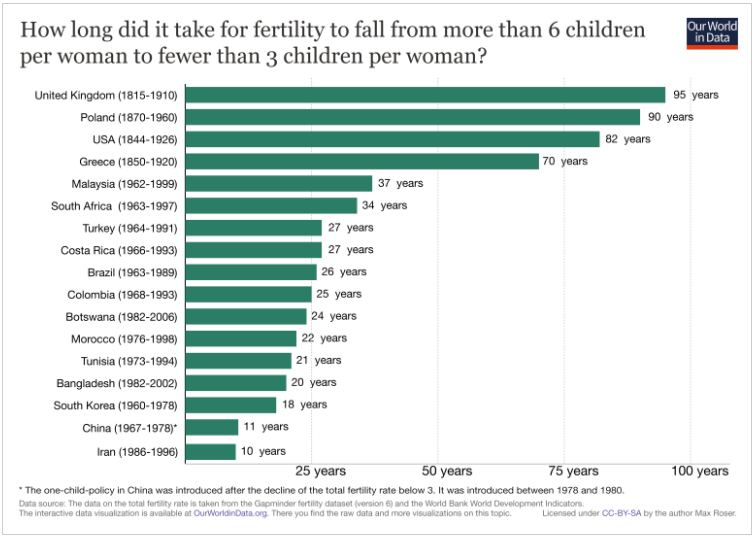
  2. Birthrates can fall fast. Like, really really fast. Growing up in the US, I always thought of birthrates as something that sort of slowly trended downward as countries grew more developed. What I didn’t realize is that it doesn’t always happen this way. Our World in Data has an interesting chart that shows how long it took for various countries to go from a birthrate of 6 or more children to 3 or fewer:  What’s stunning about this is that some of these numbers are half a generation. For birthrates to fall that quickly in Iran for example, it doesn’t just mean women were having fewer children than their mothers, it means they started having fewer children than their older sisters. In case you’re curious if these trends were just a product of instability in those countries during those times: today the birthrate in Bangladesh is 2.17, South Korea is 1.26, China is 1.60, Iran is 1.97 (per Wiki/CIA Factbook). It seems like all the downward trends shown here kept up or accelerated. China obviously made this a formal policy, but it does not appear the other countries did. I found this interesting because we often hear about subtle factors/cultural messages that impact birthrates, but there’s nothing subtle about these drop offs.
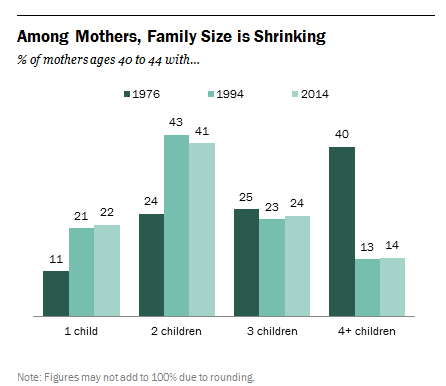
  3. A reduction in those having large families impacts the average as much (or more) than the number of women going childless. One of the first things that comes up when you talk about dropping fertility rates is the number of women who remain childless. While childless women certainly cause a drop in fertility rates, it’s important to note that they are also lowered by the number of women who don’t have large numbers of kids. I don’t have the numbers, but I would guess that the countries in point #2 ended up with lower fertility rates not because of a surge in childless women, but by a major decrease in women having 6 or more children. If we look at the change in family size in the US since 1976, the most notable drop is women having 4+ kids. From Pew Research:My first takeaway from this is that the appeal of having 3 children is timeless. My second takeaway is that it appears a large number of people aren’t crazy about having a large family. This matches my experience, because while you often hear people ask those without children or with one child “why don’t you have more kids?” you don’t often hear people ask those with 2 children the same thing. My friends with 3 children inform me that they actually start getting”you’re not having more are you?” type comments and I’d imagine those with 4 or more get the same thing routinely. Now I grew up going to Baptist school and my siblings were all home schooled at some point, so I am well aware that there are still groups that support/encourage big families. However, even among those who like “big families”, I think the perception of what “big” is has shrunk. I have friends who talked incessantly about wanting big families, married early and were stay at home moms, and none of them have more than 5 children. Most of us don’t have to go more than a generation or two back in our family trees to find a family of 5 kids or more. It seems like even those who want a big family think of it in terms of “more children than others” as opposed to an absolute number. Yes, the Duggars exist, but they are so rare they got a TV show out of the whole thing.
  4. International adoption likely doesn’t get factored in. As mentioned above, I probably know an above average number of people with 4+ children. Many of these families have a mix of biological and adopted children, frequently foreign adoptions. According the the CDC though, it doesn’t appear those adopted children are not counted in birthrate data, as they calculate that off of birth certificates issued for live births taking place in the US during a given year. Now of course this isn’t a huge impact on overall numbers: there are currently only about 5,000 international adoptions/year in the US, down from a high of 15,000 or so, vs 4,000,000 overall births. However, it is interesting to note that “number of kids” does not always equal birthrate. Since the US is the biggest adopter of foreign children in the world, it is a thing to keep in mind here.
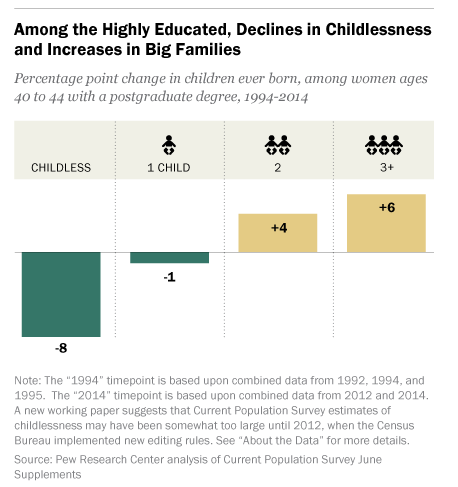
  5. The demographics of who doesn’t have kids are changing When you mention “women without children” the vision that immediately springs to mind is a well educated white woman who put her career first. Interestingly enough, this stereotype is increasingly untrue, and is changing in many countries. According to Pew Research, childlessness among women with post-graduate degrees has dropped quite a bit in the last 20 years, and the number of women in that group with 3+ kids has gone up:According to the Economist, in Finland women with a basic education are less likely to have children than their more educated peers, and other countries are trending the same way. The US is nowhere near flipping, but it is an interesting trend to keep an eye on. Historically, education has always been associated with dropping fertility rates, so this would be huge if it switched.

Overall, I thought the data out there on the topic was pretty interesting. The worldwide trends make it interesting to try to come up with a hypothesis that fits all scenarios. For example, we know that effective birth control must impact the number of children people have, but Britain and the US both had birthrates under 3 decades before oral contraceptives came in to play. Economic resources must play a part, and yet it’s the richest countries that have the lowest birthrates. Wealth is sometimes linked to higher numbers of children (particularly among men), but sometimes it’s not. Education always lowers fertility rates, except that’s started to reverse. Things to puzzle over.

From the Archives: How Often Does SCOTUS Agree?

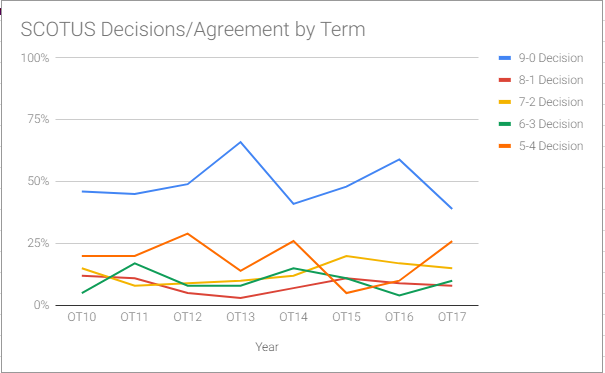
With all the talk about Supreme Court nominations going on, I thought I’d take this opportunity to revisit a post I did back in 2012 about the level of agreement between Supreme Court Justices. I wrote the post because there seemed to be a perception that the Supreme Court was deeply divided, when the reality is that the most common outcome is a 9-0 decision. I got my data from the very cool SCOTUSblog Stat Pack, and they’ve kept putting them out every year since I posted. They now have 7 years worth of data, so I decided to make a graph of how often the Justices agree each term:

As you can see, the unanimous decision is still the most common outcome, with the 8-1 decision generally being the least common.

Back in 2012 (at the end of OT11), I mentioned that Roberts and Kennedy were the most likely to vote with the majority. Per the stats, they still are. At the time, Ginsberg was the most likely to dissent, now it’s Sotomayor.

The justices most likely to agree are Ginsberg/Sotomayor and Alito/Thomas, and the justices least likely to agree are basically the same, but with the partners swapped. Even the justices who agreed the least agreed 50% of the time on disputed cases. When you add in that half of all cases are unanimous, that means our most dissimilar justices agree 75% of the time.

To note on the above stats: SCOTUSblog breaks this down by both all cases and non-unanimous cases, and it basically doesn’t change. Focusing on just 5-4 cases changes things a bit, but that’s mostly because there’s so few of them.

They also did a round up on just 5-4 cases, and the influence Kennedy had over the years. Here’s the graphs they put out:

I’ll be interested to see who the next Justice is, and if the way the cases are decided change substantially. In evaluating the impact of any change though, we have to have a sense of what the baseline is. Thanks to SCOTUSblog for making that easier.


What I’m Reading – July 2018

Hey hey! I’m back from Juneau and a brief stop in San Diego, and life is good. The wedding was great, the bride gorgeous, and I made it through my toast/maid of honor duties/boat ride to the venue without an issue. Juneau was as lovely as promised, and we had a great time.

I have to say though, I have never been to a place with less predictable weather than Juneau. Ever single day we were there it said it would be 60 degrees and raining, yet the temperature would vary wildly and the amount of time it rained was highly uneven. Sometimes “rain” meant 30 minutes, sometimes hours. One of the groomsman told me that if you predicted rain in Juneau every day, you’d be right 2/3rds of the time.  Of course I looked this up and discovered that it’s pretty much true.

Quite the leap to go to San Diego right after, where if you predicted sun every day you’d also be right about 2/3rds of the time. Also, San Diego is a borderline desert with 12 inches of precipitation a year, and Juneau gets enough rain to make it a rain forest (77 inches) and a healthy dose of snow (78 inches). For reference, Boston gets 43 inches of rain/year (close to the national average of 39) and 44 inches of snow.

Other than weather reports, I enjoyed this article about some recent discoveries that shed some light on human sacrifice practices among the Aztecs. Much of our information about human sacrifice comes from the Conquistadors, and there have always been questions about how accurate they were, given that they used it to justify a lot of their own killing. Recent discoveries suggest that the practice may have been quite widespread in the capital, as a whole temple of skulls was discovered. Sounds like the start of a horror movie to me.

This article about Crossfit covers a lot of ground, but the accusations of scientific fraud were pretty interesting to me. Basically, for several years Crossfit employees had been accusing the National Strength and Conditioning Association of publishing/sponsoring bogus papers designed to make Crossfit look bad because they were a rival. Some of their accusations sounded like the stuff of conspiracy theories, until a few lawsuits proved they were actually right. Now three papers alleging problems with Crossfit have been retracted, and internal memos from the NSCA show they did consider Crossfit a rival, and that they did encourage paper authors to put more negative data in their papers. Unfortunately for the investigators, they now can’t produce how they got that data, and the papers have been yanked. It sounds all good for Crossfit, until one of the employees who led the charge started tweeting anti-LGBT things and got fired. Still an interesting and troubling case for those concerned about scientific integrity.

This is old, but I had no idea NASA scientists ranked the least/most realistic science fiction movies back in 2011. It came up because Jurassic Park was #6, and we were talking about the De-extinction Project.

The AVI did not like my “50 Songs for 50 States” link in the comments section on my Alaska post, so I started looking around for other versions. I found a few other versions, but it occurred to me I’m judging all of the lists off of what they list for Massachusetts and New Hampshire. Really I think Ben just needs to write one of these. In the meantime in honor of our heat wave, here’s a song about summer in New Hampshire that’s better than the of the picks on any of these lists: