I was talking to my son (age 6) a few days ago, and was surprised to hear him suddenly state “Mama, I NEVER want to go to the middle of America”. Worried that I had somehow already managed to inadvertently make him in to one of the coastal elite, I had to immediately ask “um, what makes you say that?”. “The middle of America is where tornadoes are, and I don’t want to be near a tornado”, he replied. Oh. Okay then.
Apparently one of his friends at school had started telling him all about tornadoes, and he wanted to know more. Where were most of the tornadoes? Where was the middle of America anyway? And (since I’m headed to Nebraska in a week), what state had the most tornadoes?
We decided to look it up, and the first thing I found on Google image search was this map from US Tornadoes:
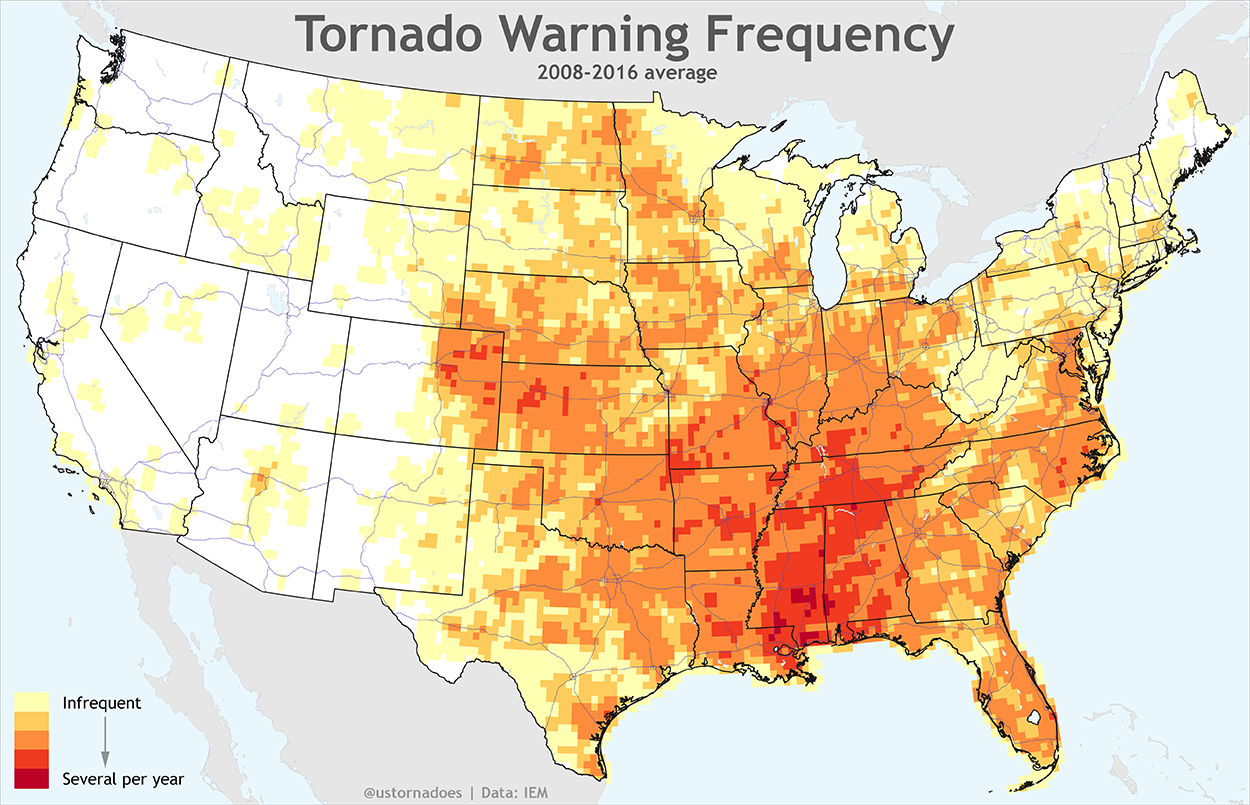
Source here. I was surprised to see the highest concentration was in the Alabama/Mississippi area, but then I realized this was tornado warnings, not tornadoes themselves. The post that accompanies the map suggests that the high number of tornado warnings in the Mississippi area is because they have a much longer tornado season there than the Kansas/Oklahoma region that we (or at least I) normally think of as the hotbed for tornadoes.
Areas impacted by tornadoes vary a bit depending on what you’re counting, but this insurance company had a pretty good map of impacted areas here:

Measuring can vary a bit for two reasons: what you count as a tornado, and how you calculate frequency. The National Oceanic and Atmospheric Administration puts out a few different types of numbers: average number of tornadoes, average number of strong to violent tornadoes, tornadoes by state and tornado average per 10,000 square miles. Those last two are basically to help account for states like Texas, which gets hit with more tornadoes than any other state (155 between 1991 and 2010), but mostly because it’s so big. If you correct that to look at a rate over 10,000 square miles, it dips to 5.9….well below Florida (12.2) and Kansas (11.7).
Florida coming in ahead of Kansas surprised me, but this is where strength of tornadoes comes in. Apparently Florida has lots of weak tornadoes. Looking at only strong to violent tornadoes only, we get this:

The NOAA also breaks down risk by month, so I decided to take a look and see what the risk in Nebraska was for September:

I think I can reassure the kiddo that mommy is going to be just fine. Apparently if you want to go to the middle of America but avoid tornadoes, fall is a pretty good bet.
Of course after we got the numbers down, we went to YouTube and started watching storm chaser videos. While he thought those were fascinating, he did have a reassuring number of questions along the lines of “mama, why did the people in the video see the tornado but not run away?”. Good impulse kid. Also, continuing his mother’s habit of rampant anthropomorphizing, he informed me that this video made him “very sad for the trees” (see the 35-40 second mark):


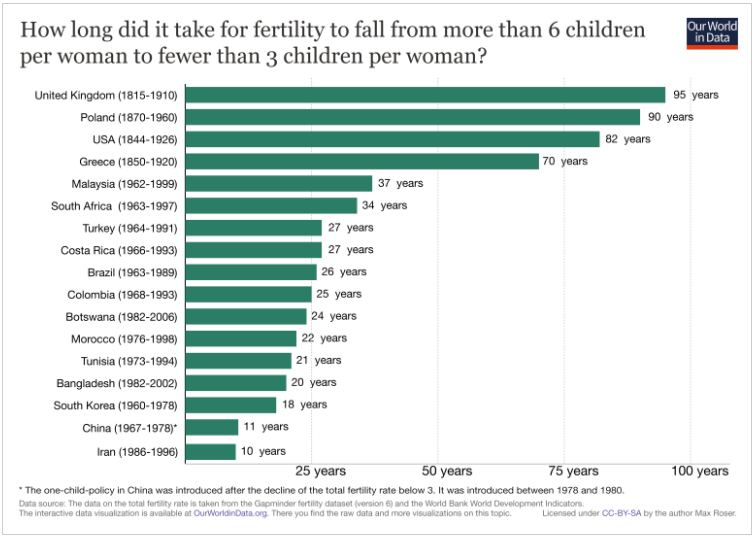
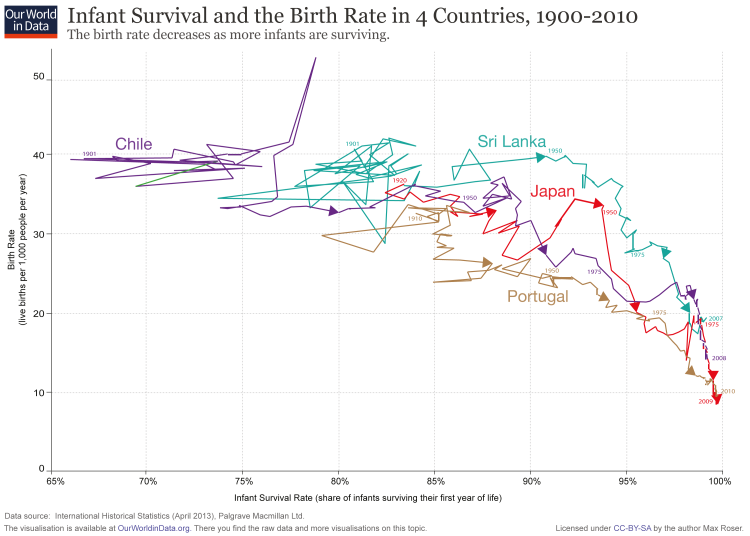 This is a good reminder that countries with total fertility rates of 6 children/woman or more almost never result in families of 6 adult children, and that our drops in fertility rate aren’t always as dramatic as they sound. For example, in the year 1800 in the US, the fertility rate was nearly 7 children/woman, while today it is just under 2. However, if you factor child mortality in, the drop is much less dramatic: