Why most marriage statistics are completely skewed

Apparently Slate.com is now doing a “map of the week”.  This week, it was a map of states by marriage rate.  Can’t get it to format well….click on the map and drag to see other states.

http://a.tiles.mapbox.com/v3/slate.marriage.html#4.00/40.65/-95.45

It shows Nevada as the overwhelming winner, with Hawaii second.  This reminded me about my annoyance at most marriage data.

Marriage data is often quoted, but fairly poorly understood.  The top two states in the map above should tip you off as to the major problem with marriage data derived from the CDC in particular….it’s based on the state that issued the marriage license, not the state where the couple resides.  Since all (heterosexual) marriages affirmed by one state are currently recognized by every other state, state of residence information is not reported to the CDC.  This means that states with destination wedding type locations (Las Vegas anyone?) skew high, and all others are presumably a bit lower than they should be.  Anecdotally, it’s also conceivable that states with large meccas for young people (New York City, Boston, DC) may be artificially low because many young people return to their childhood home states to marry.  This

The other problem with marriage data is the resulting divorce data is even more skewed.  Quite a few states don’t report divorce statistics at all (California, Georgia, Hawaii, Indiana, Louisiana, Minnesota) and the statistics from the remaining states are often misinterpreted.  One of the most commonly quoted statistics is that “50% of marriages end in divorce”.  This isn’t true.

In any given year, there are about twice as many marriages as there are divorces….but thanks to changing population, changing marriage rates, people with multiple divorces, and the pool of the already married, this does not mean that half of all marriages end in divorce.  In fact, if you change the stat to “percent of people who have been married and divorced”, you wind up at only about 33%.  More explanation here.

Ultimately, when considering any marriage data, it is important to remember that there are no national databases for this stuff.  All data has to come from somewhere, and if the source is spotty, the conclusions drawn from the data will likely be wrong.  This all applies to quite a few types of data….but marriage data is used with such confidence that it’s tough to remember how terrible the sources are.  A few people have let me know that I’ve ruined infographics for them forever, and I’m hoping to do the same with all marriage data.

You’re welcome.

Compensation Data for Mother’s Day

This year for Mother’s Day, use data to figure out how much you owe your mother for her pregnancy and labor.

It turns out I owe mine $99.28*.  I got some good discounts for my low birth weight and my early arrival.  I also got a decent “good offspring” discount for calling her this morning to wish her a happy Mother’s Day, so that was positive.  
Of course, one could quibble that perhaps a mother should not be charging her child for a pregnancy that the child did not have a say in….though the idea of issuing a bill to my own child in 12 weeks or so when he shows up is tempting.  For now though, I think I’ll pass the bill off to my Dad and see if he’d like to chip in.  I’m pretty sure the Edible Arrangement I sent her should cover my half. 
Good luck with the rest Dad.

Love you Mom!

*I am not even going to try to criticize this number.  There is absolutely no explanation for any of the numbers or why they vary the way they do.  This is actually somewhat refreshing to me.  Normally you have overly precise numbers being justified by vague guesses.  Here they don’t even pretend to have reasons.  I like the tacit admission of complete BS.  

Historical accuracy, ngram style

I’ve used google ngram’s a few times on this blog already, mostly for silly things, but this website has the best use of it I’ve seen so far.

He takes the scripts of Downton Abbey (WWI) and Mad Men (1960’s) and feeds them through the ngram to find out which phrases are the most anachronistic.

I find the whole project pretty cool, because apparently he took the whole project on as a response to a few magazine articles about phrases that wouldn’t have been said at the time.  It struck him that those phrases were just the ones that people could hear and think “hey, that sounds modern!”, but no one was thinking through what phrases we might have gotten so used to we weren’t even recognizing as out of place.

I’ve never seen Downton Abbey, and only seen an episode or two of Mad Men, but I still found it interesting what they got wrong.  The last episode of Mad Men apparently had an aspiring actress use the phrase “got a callback”, which apparently was barely used in a theater context at the time (he cross references the OED).  He also makes pretty charts, which I loved (this one is for Downton Abbey):

Overall, a very fun use of data.

Some infographic love for my little brother

My wonderfully liberal little brother is having a rough week, so I thought I’d cheer him up in the best way I know how….by criticizing a Republican infographic.

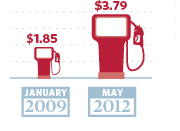
He sent me this one this morning, and while it’s a little sparse, the bottom right hand corner caught my eye:

Now, I have no idea how much was given to Solyndra, or how many jobs wind energy has left, but I do know a thing or two about gas prices and infographic figures.

First, those gas pumps are totally deceptive. $3.79 is almost exactly 2 times $1.85.   Fine.  However, let’s look closely at those gas pumps:

I pulled out the ruler when I cropped the photo, and confirmed my suspicions.  The larger pump in the picture doubles both the height and the width of the first pump.  That’s not twice as big….that’s four times as big.  I’m sure they’d defend it by pointing to the dashed lines in the background and saying only the height was supposed to be reflective, but it’s still deceptive.  Curious what a gas pump actually twice as big would look like?  Here you go….original low price on the left, original “double” price on the right, actual double in the middle.

Graphics aside, let’s look at the numbers.

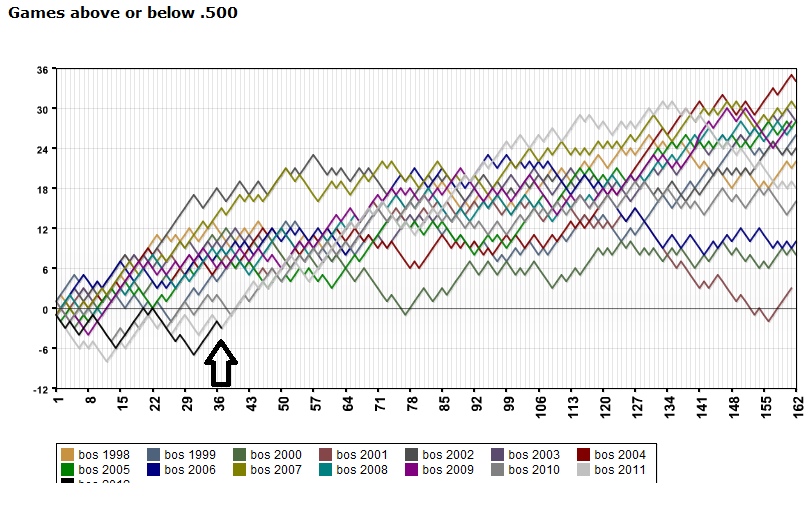
2009 was just not that long ago, and I know that $1.85 was quite the anomalous price at the time.  I’ve seen that stat more than once recently, and I have been annoyed by it every time.  Tonight, I decided to check my memory on it, and see if that dip really was the aberration I remember it being.  Don’t remember either?  Here’s the graph of average gas prices since 1978, per the BLS generator:

That dip towards the end there with the arrow?  That hit right as Obama was taking office.  In July of 2008, gas was an average of  $4.15 per gallon.  By January of 2009, it was $1.84.    I have not a clue why that drop happened, but I do know that to treat that $1.85 number as though it was standard at the time is a misrepresentation.

You can see this a bit better if you isolate George W Bush’s presidency:

Now, you could accurately say that George Bush took office with gas prices at $1.53 and left with them at $1.74….but clearly that would ignore a whole lot of data in between.  
Now here’s the averages and standard deviations for each term of the presidencies:
GWB – 1st term GWB – 2nd term BHO – current term
Average Gas Price 1.63 2.78 2.99
Standard Deviation 0.22 0.56 0.56
Now, none of this adjusted for inflation.  By adjusting the yearly averages to 2010 dollars, I got the second term of GWB to $2.99, and the current term for BHO to $3.00.  
You don’t have to like Barack Obama, and you certainly don’t have to like gas prices.  No matter what your political affiliation, I think we can all agree on one thing: ALWAYS beware of infographics.

What I missed

Apparently in my travels, I missed the series premier of a new History channel show: United Stats of America.

I was hoping it would be up my alley, but reading the synopsis makes me suspicious it’s going to be more about reciting cool numbers than figuring out if those numbers have any accuracy.  Sigh.

Greetings from Maine

After a treacherous journey up Route 1 (over an hour to clear the city of Boston), I’m pleased to tell you that we’re coming to you tonight from Portland, Maine.

I’m running a conference tomorrow at University of Southern Maine about bone marrow transplant patients who have to travel long distances….or as it’s more flourishingly called “Improving Patient Pathways for Complex Care Across Multiple Healthcare Systems”.  This is not my forte, and thus I have nothing long winded tonight….but after the stress of conference planning, I’m sure I’ll have to spend several weeks with nothing but numbers and spreadsheets before I calm down.

While we wait to see where that takes me, I thought I’d continue my pattern of figuring out a good Google Ngram for the trips I take.  This time I decided to run all the New England states to see who got mentioned the most.  

I’m happy to see Massachusetts made a strong showing.  Connecticut managed to eek a win over Maine, and it looks like Vermont, New Hampshire and Rhode Island have just been hanging out for years.

Who represents you best?

Another day, another infographic:
Via: TakePart.com

 Sigh. It’s an election year, so I know I’m going to be seeing a lot of these types of things and I should just get over it but…I can’t.

I really dislike this one, because while the data may be good (I haven’t checked it), I think the premise is all wrong and perpetuates faulty ideas.

Congress is a nationally governing body that is split up by state.  Thus, even if Congress was perfectly representative on a state to state basis, it would still very likely not look like the USA as a whole.  

For example, let’s take Asian Americans and Pacific Islanders.  According to the census bureau, 51% of this demographic lives in just 3 states:  California, New York and Hawaii. Nine states pull fewer than 1% of their population from this demographic:  Alabama, Kentucky, Mississippi, West Virginia, North Dakota and South Dakota, Montana, Wyoming and Maine.  4.2% may be the national average, but Hawaii is 58% Asian, and West Virginia is 0.7% Asian.  For one, it would be ethnically representative to have at least half of their reps be Asian every year, for the other it’s statistically unlikely to happen.

If you wanted a really impressive infographic, you’d take each state’s individual ethnic breakdown and cross reference it with how many representatives they had in Congress to figure out what a representative sample should be.  Adding those up would give you the totals for racial diversity when judged on a state level, not a national level.

Of course, that’s only the racial numbers, though the same could apply to the religion questions.  This doesn’t work for the gender disparity…gender ratios are pretty close to 50/50 (Alaska has the highest percentage of men, Mississippi has the lowest).  I think that’s a more complex issue, since you have to take in to account the number of women desiring to run for office (lower than men), and then the counterargument that fewer women want to run because they believe they’re less likely to win or more likely to be crticized.  It’s a tough call how many women there should be to be truly representative since both sides can argue the data.

The income, age, and education numbers I’d argue are all due to the nature of the job.  Campaigning is expensive, and neither Representative nor Senator are not exactly entry level jobs.

As the comments from yesterday’s post showed,  one of the least representative parts of Congress is profession.  Lawyers make up 0.38% of the population, and yet 222 members of Congress have law degrees (38% of the House, 55% of the Senate).  That seems highly unrepresentative right there.

At the end of the day, we vote for people who represent our state, not necessarily our gender, religion or race.  In Massachusetts, our current Senate race is between a 52 year old white male lawyer and a 62 year old white female lawyer. The biggest difference demographically in my eyes?  One has lived in Massachusetts for decades, and the other….lived here long enough to qualify to run.  No one’s going make a pretty picture out of that factor, but it’s pretty important when it comes to getting adequately represented.

Are Republicans Stupid?

One of my favorite things about blogging is it’s potential to actually change the way I personally think about things.  I don’t mean just through the comments section, though that is immensely helpful, but more so through the process of researching, writing, posting and following up.  A few posts on one topic, and suddenly I find myself passionate on topics that had previously been mere blips on my radar.  God bless the internet.

All that is to say, a month ago I didn’t really care what people said about politics and science.  Sure, in my own blog rules, rule number 2 said I would stay non-partisan:

I will attempt to remain non-partisan. I have political opinions.  Lots of them.  But really, I’m not here to try to go after one party or another.  They both fall victim to bad data, and lots of people do it outside of politics too.  Lots of smart people have political blogs, and I like reading them…I just don’t feel I’d be a good person to run one.  My point is not to change people’s minds about issues, but to at least trip the warning light that they may be supporting themselves with crap. 

Even so, if someone had casually made the comment that Republicans were anti-science, I probably would have let it go.  After all, I spent most of my pre-adulthood years in a Baptist school that had plenty of Republican voting ignorants to color my view.

But…..then I did this post.
And this one.
And of course this one.

And now I don’t feel those comments are quite as innocuous as I once did.

My feelings on this were backed up by this article from Forbes magazine (where this posts title came from), which I really really recommend if you have the time.

I’m not going back on my non-partisan premise, but as Mr Entine so eloquently posits, one party laying claim to “science” does nobody any good.  Science never fares well when put in the hands of politicians (does anything really?) and giving one party the moral upper hand in a subject as broad as “science” can cause damaging oversights.

To be honest, I don’t know which party is more “pro-science”.  The data required to prove that one way or the other would require compiling a complete list of scientific topics, ranking them in order of possible impact to both people and the world at large, ranking the conclusiveness of the data, and conducting public opinion polls broken down by party and controlled for race, class and gender.  That’s an enormous amount of work, and nobody has done it.

Thus, until further research is done, I will stick with the following conclusions:

  1. Politicians will exploit everything they can if they think it will get them more votes
  2. Ditto for journalists (sub “readers” for “votes”)
  3. Saying you’re “pro-science” is not the only requirement for being “pro-science”
  4. Increasing the general level of knowledge around research methods, data gathering and statistical analysis is probably a good thing
Seriously though, read the Forbes article.