There was an interesting graph in a recent New York Times article that got Twitter all abuzz: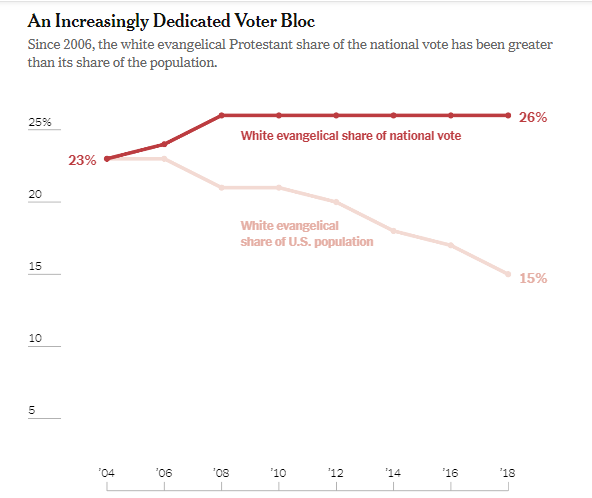
Visually, this graph is pretty fascinating, showing an increasingly motivated white Evangelical group, whose voter participation rates must put every other group to shame. I was so taken aback by this I actually did share it with a few people as part of a point about voter turnout.
After sharing though, I started to wonder how this turnout rate compared to other religious groups, so I went looking for the source data. A quick Google took me to this Pew Research page, which contained this table:
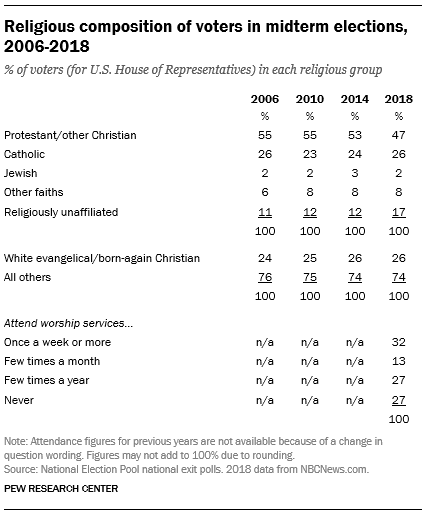
Two things surprised me about this:
- Given the way the data is presented, it appears the Evangelical question was asked by itself as a binary yes/no, as opposed to being part of a list of other options.
- The question was not simply “are you Evangelical” but “are you Evangelical/born again”.
Now from researching all sorts of various things for this blog, I happen to know that one of the most common ways of calculating how many white Evangelicals there are in the population is to ask people their denominational affiliation from a menu of choices, then classify those denominations in to Evangelical/Catholic/etc. That’s what PPRI (the group that got the 15% number) does.
For the voting block question however, they were only asked if they were a “White born-again or evangelical Christian?”
Now to get too far in to the theological nuances, but there are plenty of folks I know who would claim the “born again” label who don’t go to traditionally “Evangelical” churches. In fact, according to Mark Silk over at Religion News (who noted this discrepancy at the time), he’s been involved with research that “found that 38.6 percent of mainline Protestants and 18.4 percent of Catholics identified as “born again or evangelical.” So yes, the numbers may be skewed. It’s also worth noting that Pew Research puts the number of Evangelical Protestants at 25%, in a grouping that categorizes historically black groups separately (and thus is presumably mostly white).
So is the Evangelical turnout better than other groups? Well, it might still be. However, it’s good to know that this graph isn’t strictly comparing apples to apples, but rather slightly different questions given to different groups for different purposes. As we know slight changes in questions can yield very different results, so it’s worth noting. Caveat emptor, caveats galore on this one.