Okay, I just said I was blogging less, but this story was too interesting to pass without comment. A few days ago it was announced that the Supreme Court had agreed to hear a case about gerrymandering, or the practice of redrawing voting district lines to influence the outcome of elections. This was a big deal because previously the court has only heard these cases when the lines had something to do with race, but had no comment on redraws that were based on politics. The case they agreed to hear was from Wisconsin, and a lower court found that a 2011 redistricting plan was so partisan that it potentially violated the rights of all minority party voters in the affected districts.
Now obviously I’ll leave it to better minds to comment on the legal issues here, but I found this article on how statisticians are getting involved in the debate quite fascinating. Obviously both parties want the district lines to favor their own candidates, so it can be hard to cut through the noise and figure out what a “fair” plan would actually look like. Historically, this came down to just two parties bickering over street maps, but now with more data available there’s actually a chance that both gerrymandering and the extent of gerrymandering can be measured.
One way of doing this is called the “efficiency gap” and is the work of Eric McGhee and Nicholas Stephanopolous, who explain it here. Basically this measures “wasted” votes, which they explain like this:
Suppose, for example, that a state has five districts with 100 voters each, and two parties, Party A and Party B. Suppose also that Party A wins four of the seats 53 to 47, and Party B wins one of them 85 to 15. Then in each of the four seats that Party A wins, it has 2 surplus votes (53 minus the 51 needed to win), and Party B has 47 lost votes. And in the lone district that Party A loses, it has 15 lost votes, and Party B has 34 surplus votes (85 minus the 51 needed to win). In sum, Party A wastes 23 votes and Party B wastes 222 votes. Subtracting one figure from the other and dividing by the 500 votes cast produces an efficiency gap of 40 percent in Party A’s favor.
Basically this metric highlights unevenness across the state. If one party is winning dramatically in one district and yet losing in all the others, you have some evidence that those lines may not be fair. If this is only happening to one party and never to the other, your evidence grows. Now there are obvious responses to this….maybe some party members really are clustering together in certain locations….but it does provide a useful baseline measure. If your current plan increases this gap in favor of the party in power, then that party should have to offer some explanation. The author’s proposal is that if the other party could show a redistricting plan that had a smaller gap, the initial plan would be considered unconstitutional.
To help with that last part, two mathematicians have created a computer algorithm that draws districts according to state laws but irrespective of voting histories. They then compare these hypothetical districts “average” results to the proposed maps to see how far off the new plans are. In other words, they basically create a normal distribution of results, then see how the current proposals line up. To give context, of the 24,000 maps they drew for North Carolina, all were less gerrymandered than the one the legislature came up with. When a group of retired judges tried to draw new districts for North Carolina, they were less gerrymandered than 75% of the computer models.
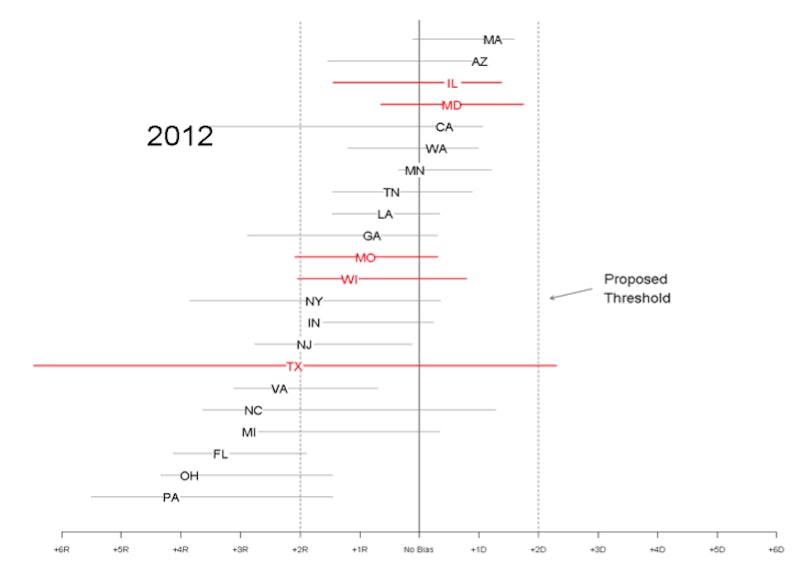
It’s interesting to note that some of the most gerrymandered states by this metric are actually not the ones being challenged. Here are all the states with more than 8 districts and how they fared in 2012. The ones in red are the ones facing a court challenge. The range is based on plausible vote swings:
Now again, none of these methods may be perfect, but they do start to point the way towards less biased ways of drawing districts and neutral tests for accusations of bias. The authors note that the courts currently employ simple mathematical tests to evaluate if districts have equal populations: +/- 10%. It will be interesting to see if any of these tests are considered straightforward enough for a legal standard. Stay tuned!

It is always a bit jarring to me that these discussions always divide things entirely in terms of how it turns out for exactly two parties, with no reference to the underlying cultures. I understand how we get there, but it still bothers me. If the people who work in the mines live primarily in District 3, the Cambodian immigrants live in District 4, and the fishermen live in District 5, then there is something artificial about rejiggering those boundaries so that the Democrats and Republicans each get their share.
LikeLike
Yeah, kind of a case of “easy to measure” vs “potentially important”. The whole thing gets mucked up further when those populations shift in proportion to one another, and then one party has to make a call about how to redistribute the votes. If District 3 outgrows itself is it “fair” to put all those votes in District 4 or District 5, or a few in each? The first way possibly changes the culture of 4 or 5 (and then pick which one) and the second one might mean that the extra growth in District 3 impacts nothing, which also seems weird.
By the way, what do you know about how the NH lines get drawn? I was looking at them, and despite the most obvious cultural grouping in NH being North/South, I note the lines are drawn East/West. This appears to be because Concord and Manchester have to be split up, but it does make for an odd grouping.
LikeLike