A Warm Hello!
Well hello there! It’s been a while. Unfortunately I’ve been dealing with some (non-COVID related) health issues that have made reading and writing rather difficult, so blogging has been taking a back seat to things like um, paid employment. You know how it goes. I’ve missed you guys though, and thank you to those who reached out with nice messages asking how I was doing. That was appreciated.
Anyway, for the first time in a long time I recently fell down a rabbit hole of data and started putting together an exceptionally lengthy email with graphs for a small email group, when I realized I may as well just turn this in to a blog post in case any one was still poking around here and might be interested. So here we are.
Some Background About Data That’s Currently Interesting Me
So despite the aforementioned reading/writing troubles, I have of course been interested in the data coming out of the COVID-19 pandemic. I could go on and on about many things, but one of my top fixations is the difference between the state level reported COVID deaths (compiled by the CDC here) and the overall excess mortality across the US compiled by the CDC here.
Essentially the first set of numbers is exactly what it sounds like: the number of people in a state that the state says have died of COVID-19. The second number is a little more interesting. Basically the CDC has years and years worth of data about how many people die each week in 1) the USA as a whole (51k-60k depending on the time of year) and 2) individual states. Thus they can predict each year how many people are going to die in a given week and then say if we are right on track with that number or if we are wildly above that number (95% confidence interval) for both the country as a whole and each state individually.
They published this data prior to COVID as well….if you’ve ever heard someone say we had a “really bad flu year” this data is probably why. If an outbreak of the flu (or anything) pushes the country above the 95% CI for expected deaths, the CDC will generally raise an alert. For example, the flu season in the winter of 2017/2018 pushed us above the 95% CI from December 23rd 2017 – February 3rd 2018. Currently the country has had excess deaths from all cause mortality since March 28th, 2020. We have yet to drop back below the 95% CI for more than a week. The graph for the whole US looks like this (recent weeks trail off as jurisdictions are still reporting):

Since 2/1/20 this comes out to 595,688 deaths above the 95% CI (yellow line) or 758,749 deaths above average.
Now while seeing the entire country interests me, what really interested me about this data is that sometimes the excess mortality data from all causes and the COVID-19 reported death data for a particular state don’t match. That’s something I wanted to look in to.
COVID-19 Deaths vs All Cause Excess Mortality
I first got interested in this topic because the first time I looked at excess mortality data, I noticed that my state (Massachusetts) had a MUCH higher number listed for COVID-19 deaths than it does for excess mortality. Checking the CDC website today, they have us listed at 18,131 deaths, or 236 COVID deaths/100k residents. However, our excess mortality since 2/1/20 is only listed as between 8,780 and 11,369. I started running the numbers because the overall COVID number puts us at 3rd worst in the nation. The lower number would rank us somewhere between #31 and #40.
I Googled a bit and as close as I could find, we’ve changed our counting method twice to better align with federal standards, but don’t appear to have subtracted the “overcounts” back off our total. This article suggests we were overcounting nursing home deaths (take that Cuomo!) until April of 2021 and this article suggests that we also included more “probable” deaths than other states until October 2020.
So given that every state counts COVID deaths differently but (presumably) counts all deaths, how common is it that a states COVID deaths exceed their excess mortality? Which states have the highest “overcounts” and “undercounts” and what does it look like if you just compare excess mortality and remove COVID classifications entirely? Well I’m glad you asked! That’s what I wanted to know too!
The Overcounts
Pulling from the CDC website here through 8/11 and taking their upper and lower guesses for excess mortality and converting to deaths/million, I found 5 states that have reported more COVID deaths (as of today 8/14) than they have excess mortality:
- Massachusetts (+1,015/million – #3 ranked)
- Rhode Island (+690/million – #5 ranked)
- Minnesota (+145/million – #37 ranked)
- New Jersey (+143/million – #1 ranked)
- Connecticut (+41/million -#9 ranked)
Now it is important to note that not all the death data is in. It is possible that these states are simply really good at reporting COVID deaths and less good at reporting other deaths, or that something else is going on. COVID could be killing people in these states who would have died anyway, and thus it could be failing to add to the excess mortality in the way it is in other states, or some mitigation effort the states took could be reducing other types of mortality in a way that is balancing COVID out. The CDC won’t close out this data for quite some time, but it will be interesting to see what happens when all the accounts are settled.
What is notable here though is that 4 of these 5 states are in the top 10 for worst death counts. If these are truly over-reported, that means the pandemics were not as bad there as commonly believed. Additionally, several of those states had fairly strict lockdowns. If excess mortality is caused by lockdowns, it is not showing up in these states data so far.
The Undercounts
Now undercounting is tricky. The CDC notes that some states have extra process in place to ensure accurate coding of COVID deaths, so it’s possible these states are just behind. It’s also possible that excess mortality in these states is from something other than COVID, so they just wouldn’t have as much COVID death as they would excess mortality. Here’s the list, there were also 5 states here. Well, 4 states and DC:
- Washington DC (-294/million – #34 ranked)
- Texas (-147/million – #26 ranked)
- California (-76/million – #32 ranked)
- South Carolina (-51/million – #21 ranked)
- Vermont (-33/million -#50 ranked)
To my point about other causes of death, Washington DC in particular would be potentially impacted by a jump in homicides (up 19% last year) and opioid deaths (hit a record in 2020). For the other states, we’ll continue to see what happens as the data trickles in.
Overall, it’s interesting that 40 states COVID deaths counts fell somewhere in between their states upper and lower bound estimate for excess mortality. So how did every state do when compared for excess mortality so far? Let’s check it out?
About the Data
A few things to keep in mind before I show state level graphs:
- The data is excess mortality from ALL CAUSES since 2/1/20.
- There’s one graph for amount above lower bound (excess above average) and amount above upper bound (excess above 95% CI). I’ll discuss the differences a bit below.
- Some of this is estimated. Since every state reports at a different pace, they estimate where states will be at to bring everyone up to the same level. I’ve been watching this for a few months and they rarely have to take many people away, so the estimates look pretty good.
- The data is from here. I download the “National and State Estimates of Excess Deaths” csv file and then use the “Total Excess Lower Estimate” and “Total Excess Higher Estimate” (Column J and K on my spreadsheet) for each state.
- To convert to per capita, I used the 2020 census numbers for each state. I included Puerto Rico and DC, so all rankings are out of 52.
There’s been a lot of talk about how the pandemic impacted other types of deaths, so it’s notable to see where the highest excess mortality has been.
Excess Mortality Over Average by State
Without further ado, here’s the excess mortality over the average, by state. Sorry about the small font, click on it to embiggen:

| State | Excess Deaths Over Average/Million (2/1/20-8/11/21) |
| Mississippi | 3635 |
| District of Columbia | 3541 |
| Arizona | 3138 |
| Alabama | 3121 |
| Louisiana | 3101 |
| Arkansas | 3012 |
| New York | 3010 |
| South Carolina | 2889 |
| New Jersey | 2861 |
| South Dakota | 2708 |
Now this is just deaths over average. Some states have more yearly variation than others, and thus look a little different if you only take the deaths above the 95%CI interval. That’s next.
Excess Mortality Over Upper Bound by State
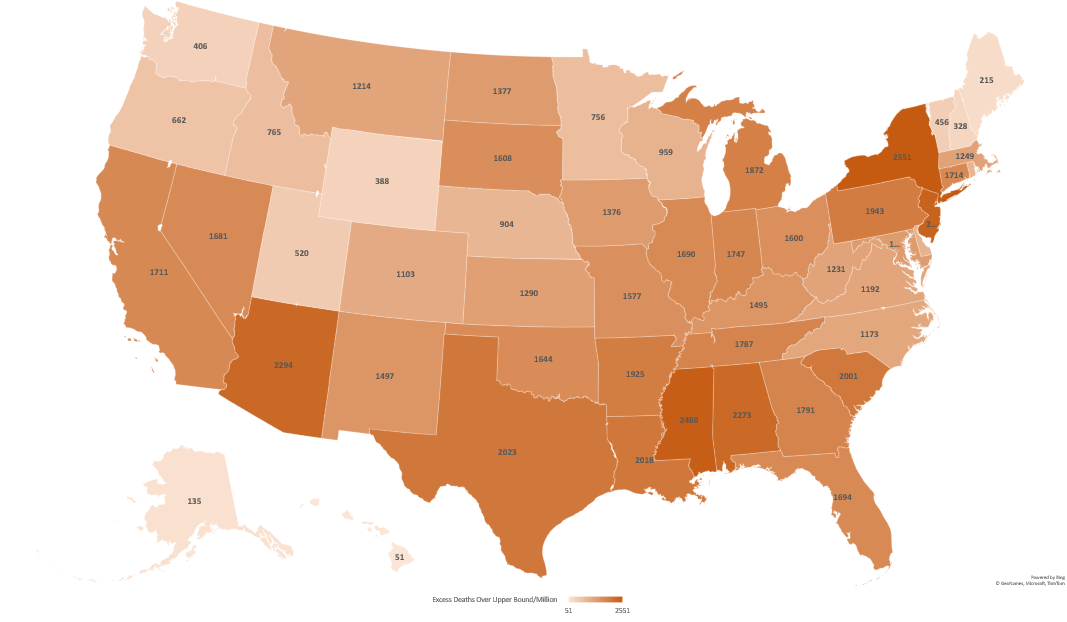
Again, click to make that bigger.
As you can see, going over the upper bound mostly evens out the smaller states. This makes sense. For example, Massachusetts and Montana had surprisingly similar excess mortality across the timespan represented. However, Montana is 1/7th the size of Massachusetts. They typically hover around 200 deaths per week statewide, and Massachusetts generally has 1,100-1,200. With 200 deaths, slight differences in reporting (like someone in one hospital forgetting to send the numbers for a week) could skew things quite a bit. That’s less likely over larger populations. So here are the new top 10:
| State | Excess Deaths Over Upper Bound/Million (2/1/20-8/11/21) | Prior Rank |
| New York | 2551 | 7 |
| Mississippi | 2480 | 1 |
| New Jersey | 2395 | 9 |
| Arizona | 2294 | 3 |
| Alabama | 2273 | 4 |
| Texas | 2023 | 16 |
| Louisiana | 2018 | 5 |
| South Carolina | 2001 | 8 |
| Pennsylvania | 1943 | 17 |
| Arkansas | 1925 | 6 |
As expected, the two places with the smallest populations (DC and South Dakota) dropped off this list and were replaced with two much larger places: Texas and and Pennsylvania.
Other States of Interest and Possible Posts Going Forward?
Now throughout the pandemic, it seems everyone gets fixated on some subgroup of “the big four”: California, Florida, New York and Texas. If you want to know how they’re doing, here they are pulled out:
| State | Excess Deaths Over Upper Bound/Million | Excess Deaths Over Average/Million | Rank in Excess Deaths Over Average | Rank in Excess Deaths Over Upper Bound |
| New York | 2551 | 3010 | 7 | 1 |
| Texas | 2023 | 2507 | 16 | 6 |
| California | 1711 | 2193 | 30 | 17 |
| Florida | 1694 | 2339 | 23 | 18 |
Here are the states I track, as they are all approximately the same size as Massachusetts (around 7 million people):
| State | Excess Deaths Over Upper Bound/Million | Excess Deaths Over Average/Million | Rank in Excess Deaths Over Average | Rank in Excess Deaths Over Upper Bound |
| Arizona | 2294 | 3138 | 3 | 4 |
| Tennessee | 1787 | 2636 | 11 | 14 |
| Massachusetts | 1249 | 1617 | 39 | 31 |
If people are interested in particular other states, I’d be happy to post them in the comments as time/health allow. Additionally, the CDC updates this data weekly. Now that I have the explanation typed out and my spreadsheet set up I can fairly easily post updates every few weeks (sans lengthy intro) if there’s interest. Let me know what you all think! Hope everyone is staying well.

Welcome back and I hope things are doing well. Thank you for the article–it is a different analysis than others I have seen.
LikeLike
I always try to be a little different! Hadn’t seen a lot on this topic elsewhere so I had to make the post I wished I was reading :).
LikeLike
Glad you aren’t a data point on the chart.
LikeLike
Always good to avoid that!
LikeLike
Linked, as promised.
LikeLike
Welcome back! Hope you are doing better. I have been hoping that someone would do a statistical analysis of COVID, so I am glad to see this. It will take some time to digest this, but I might have some questions.
LikeLike
Questions always welcome! I’m still fiddling with the data but will probably do an update to the numbers in a week or so.
LikeLike
Thanks for the info. Showing the data for age adjusted excess mortality would be interesting since the age distributions of states vary significantly and we know covid mortality rates are extremely dependent on age.
LikeLike
Interesting thought! Let me work on this
LikeLiked by 1 person
Pingback: State Level Excess Mortality Updates – Sept 8, 2021 | graph paper diaries
Pingback: State Level Excess Mortality Updates – Oct 6th, 2021 | graph paper diaries