Materialism and Post-Materialism

I got an interesting question from the Assistant Village Idiot recently, pointing me to this blog post1 on materialism and post-materialism in various countries by year, wealth of nation, wealth of individual, age and education level of respondent.  It’s an interesting compilation of graphs and research that seem to show us, as a world, moving from a materialistic mindset, to a post-materialistic mindset. So what does that mean and what’s my take?

First, some definitions.
Up front the definitions are given as follows:

Materialist: mostly concerned with material needs and physical and economic security
Post-materialist: strive for self-actualization, stress the aesthetic and the intellectual, and cherish belonging and esteem

What interested me is that if you go all the way to the end, you find that the question used to categorize people was actually a little more specific.  They asked people the following question:

“If you had to choose among the following things, which are the two that seem most desirable to you?”

  1. Maintaining order in the nation. (Materialist)
  2. Giving the people more say in important political decisions. (Post-materialist)
  3. Fighting rising prices. (Materialist)
  4. Protecting freedom of speech. (Post-materialist)

People then receive a score between 1 and 3.  If you pick both materialist options (#1 and #3), you get a score of 1. If you pick both post-materialist options (#2 and #4), you get a score 3. If you pick one of each, you get a score of 2.

So what are we seeing?

Well, this (from this paper here):

Materialistgraph

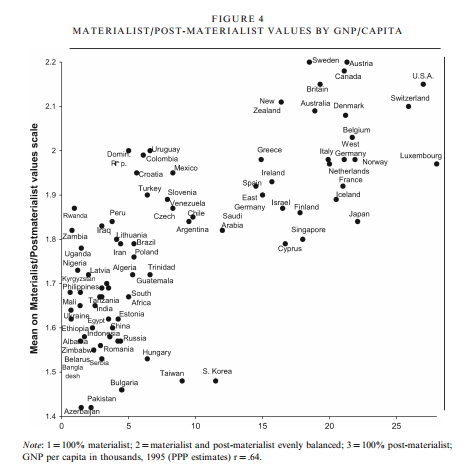
Every country in the world scores (on average) between a 1.4 and a 2.2.  There were also graphs that showed that higher class people moved toward post-materialist mindset, and that the world as a whole has been moving towards it over the years.

I do think it’s worth noting that only about 8 countries score over a 2, with a few more on the line. On the whole, more countries skew materialist than post-materialist on this scale…..though the 8 that are higher are all fairly high on the development index.

So what does this mean?

Well, it seems to be a matter of focus. In my opinion, these questions seem to serve as a proxy for current concerns as much as actual preferences. For example, I did not rank “fighting rising prices” very high, but I also live in a country that has only slow inflation for most of my life. Essentially, this appears to be a sort of political Maslow’s hierarchy of needs. It’s most likely not that people don’t care about safety or price stability, but rather they don’t prioritize it if they already have it. Additionally, I would suspect that many people would argue that they like free speech because it maintains order in a country, as opposed to actually desiring free speech over order.

Most of the data comes from one particular researcher, Ronald Inglehart, who focuses on changing values and theorizing what impact that might have on society. Inglehart is not particularly hypothesizing that being post-materialist is bad, but rather that it represents a departure from the way most people have lived for thousands of years.  Because it appears our values slant is set earlier in life, he proposes that those of us growing up in relative safety and security will always bias towards a post-materialist focus. He researches what effect that may have on society.

While some of this may seem obvious, he brings up a couple related outcomes that were fairly subtle. For instance, he points out in this paper that we have seen a reduction in voting stratified by social class, and an increase in voting stratified around social issues.  This suggests that even a very basic level of security like the type provided by our welfare systems allows people more time to focus on their values and ideals.  It varied by country, but in the US there was almost NO difference in materialist/post-materialist values by education class.

This was an interesting point, because I think many people are troubled by how contentious some of our social issue debates have gotten (abortion, women’s rights, the environmental movement, etc) have all gotten. The idea that these issues are now more contentious because more people are devoting more thought to them is intriguing. Additionally, it seems that there would be less national agreement on those types of issues in comparison to safety and security issues. If your country is under attack, there is no debate about defending yourself. We may debate the method, but the outcome is widely agreed upon. With social issues that’s not true. What effect this will have on country level stability is unknown.

Interesting stuff to keep an eye on going forward, and keep in mind this election season.

1. Max Roser (2016) – ‘Materialism and Post-Materialism’. Published online at OurWorldInData.org. Retrieved from: https://ourworldindata.org/materialism-and-post-materialism/ [Online Resource]

5 Studies About Politics and Bias to Get You Through Election Season

Last week, the Assistant Village Idiot posed a short but profound question on his blog:

Okay, let us consider the possibility that it really is the conservatives who are ignorant, aren’t listening, and reflexively reject other points of view.
How are we going to measure whether that is true?  Something that would stand up when presented to a man from Mars.

I liked this question because it calls for empirical evidence on a topic where both sides believe their superiority is breathtakingly obvious. I gave my answer in the comments there, but I wanted to take a few minutes here to review how I think you would measure this, and pull together some of my favorite studies on politically motivated bias as a general reference.

Before we start on that, I should mention that the first three parts of my answer to the original question covered how you would actually define your target demographic. Defining ahead of time who is a conservative and who is a liberal, and/or what types of conservatives or liberals you care about is critical. As we’ve seen in the primaries this year, both conservatives and liberals can struggle to establish who the “true” members of their parties are. With 42% of voters now refusing to identify with a particular political party, this is no small matter. Additionally, we would have to define what types of people we were looking at. Are we surveying your average Joe or Jane, or are we looking at elected leaders? Journalists? Academics? Activists? It’s entirely plausible that visible subgroups of either party could be less thoughtful/more ignorant/etc than the average party member.

On more thing: there’s a really interesting part in Jonathan Haidt’s book “The Righteous Mind” where he talks about how conservatives are better at explaining liberal arguments than liberals are at explaining conservative ones. As far as I can tell, he did not actually publish this study, so it’s not included here. If you want to read about it though, this is a good summary. Alright, with those caveats, let’s look at some studies!

  1. Overall Recognition of Bias: The Bias Blind Spot: Perceptions of Bias in Self Versus Others This one is not politically specific, but does speak to our overall perception of bias. This series of studies asked people (first college students, then random people at an airport) to rate how biased they were in comparison to others. They were also asked to rate themselves on other negative traits such as procrastination and poor planning. Most people were happy to admit they procrastinate even MORE than the average person, but when it came to bias almost everyone was convinced they were better than average. Even after being told bias would likely compel them to overrate themselves, people didn’t really change their opinion. That’s the problem with figuring out who is more biased. The first thing bias does is blind you to it’s existence. It would be rather interesting to see if political affiliation influenced these results though. In the meantime, try the Clearer Thinking political bias test to see where you score.
  2. Biased Interpretations of Objective Facts: Motivated Numeracy and Enlightened Self-Government  Okay, I bring this study up a lot. I wrote about it both here and for another site here.  In this study people were presented with one of four math problems, all containing the same numbers and all requiring the same calculations. The only thing that changed in each version of the problem was the words that set up the math. In two versions, it was a neutral question about whether or not a skin cream worked as advertised. In the other two versions, it was a question about gun control. The researchers then recorded whether or not your political beliefs influenced your ability to do math correctly if doing so would give you an answer you didn’t like. The answer was a strong YES. People who were otherwise great at math did terribly on this question if they didn’t like what the math was telling them. This effect was seen in both parties. The effect was actually worse the better at math you were. The effects size was equal (on average) for both parties.
  3. Dogmatism and Complex Thinking: Are Conservatives Really More Simple-Minded than Liberals? The Domain Specificity of Complex Thinking I posted about this one back in February when I did a sketchnote of the study structure. This study took a look at dogmatic beliefs and the complexity of the reasoning people used to justify their beliefs. The study was done because the typical “dogmatism scale” used to study political beliefs had almost always showed that conservatives were less thoughtful and more dogmatic about their beliefs than liberals were. The study authors suspected that finding was because the test was specifically designed to test conservatives on things they were, well, more dogmatic about. They ran several tests, and each showed that dogmatism and simplistic thinking were actually topic specific, not party specific. For example, conservatives tended to be dogmatic about religion, while liberals tended to be more dogmatic about the environment. This study actually looked at both everyday people AND transcripts from presidential debates for their rankings. The stronger the belief, the more dogmatic people were.
  4. Asking People Directly: Political Diversity in Social and Personality Psychology While we generally assume people won’t admit to bias, sometimes they actually view it as the rational choice. In this paper, two self-described liberal researchers asked other social psychologists what their political affiliation was and if they would discriminate on . They found that social psychology was quite liberal, though most people within the field actually overestimated this. Additionally, many people reported that they would discriminate against a conservative in hiring practices, wouldn’t give them grants, and would reject their papers on the basis of political affiliation. I think this study is a good subset of the dogmatism one….depending on the topic some groups may be more than happy to admit they don’t want to hear the other side. Not everyone considers dismissing those with opposing viewpoints a bad thing. I’m picking on liberals here, but given the dogmatism study above, I would be cautious about thinking this is a  phenomena only one party is capable of. Regardless, asking people directly how much they thought they should listen to the other side might yeild some intriguing results.
  5. Voting Pattern Changes: Unequal Incomes, Ideology and Gridlock: How Rising Inequality Increases Political Polarization When confronted with the results of that last study, one social psychologist ended up stating that social psychology hadn’t gotten more liberal, but rather that conservatives had gotten more conservative. It’s an interesting charge, and one that should be examined a bit. The paper above took a look at this on the state level, and found that in many states the values of conservative and liberal elected leaders have changed. Basically, in states with high income inequality, liberal voters vote out moderate liberals and nominate more extreme liberals. Then, in the general election, the more moderate candidate tends to be Republican, so the unaffiliated voters go there. This means that fewer liberals get elected, but the ones who do get in are more extreme. The Republicans on the other hand now get a majority, meaning the legislatures as a whole skew more conservative. These conservatives are both ideologically farther apart from the remaining liberals AND less incentivized to work with them. So in this case, a liberal looking at their state government could accurately state “things have shifted to the right” and be completely correct. Likewise, a conservative could look at the liberal members of the legislature and say “they seem further to the left than the guys they replaced” and ALSO be correct. So everyone can be right and end up believing the best course is to double down.

Overall, I don’t know where this election is going or what the state of the political parties will be after it’s done. However, I do know that our biases probably aren’t helping.

Predictions and Accuracy: Some Technical Terms

Okay, so we started off our discussion of Statistical Tricks and Treats with a general post about contingency matrices and the two ways to be wrong, and then followed up with a further look at how the base rate involved in the matrix can skew your perception of what a positive or negative test means.

In this post I’m going to take another look at the contingency matrix and define a few words you may hear associated with them. But first, let’s take another look at that matrix from last week:

Drugsearch

Accuracy: Accuracy is the overall chance that your test is correct in either direction. So we’d have this:

Number of correct search warrants + number of innocent people left alone
Total number of tests run

Note: this SHOULD be the definition used. People will often try to wiggle out of this by saying “it’s accurate 99% of the time when drugs are present!”.  They are hoping the word “accurate” distracts you from their failure to mention what happens when drugs aren’t present. This is the type of sales pitch that leads to innocent people getting arrested and cops who had no idea the were using a test that likely to be wrong.

Sensitivity:  When that hypothetical sales person up there said “it’s accurate 99% of the time when drugs are present!”, what they were actually giving you was the sensitivity of the test. It (along with specificity) answers the question “How often does the test do what we want it to do?” The sensitivity is also called the true positive rate, and it’s basically this:

Correct warrants/arrests
Correct warrants/arrests + bad guys who got away with it

In other words, it’s the number of “correct” positives divided by the total number of positives.  Another way of looking at it is it’s the number in the top row green box over the total number in the top row. A high percentage here means you’ve minimized false negatives.

Specificity: This is the opposite of sensitivity, and in this example it’s the one the sales person is trying not to mention. This is how accurate the test is when drugs are NOT present, aka the true negative rate. It looks like this:

Number of times you left an innocent person alone
Harassed and harassed innocent people whose trash was tested

Basically it’s the number of correctly negative tests divided by the number of total negative tests. It’s also the number in the green box in the bottom row over the total number in the bottom row. A high percentage here means you’ve minimized false positives.

Positive Predictive Value: Okay, so both sensitivity and specificity dealt with rows, and this one deals with columns. Positive predictive value is a lot of what I talked about in my base rate post: if you get a positive test, what are the chances that it’s correct?

As we covered last week, it’s this:

Correct search warrants/arrests
Correction search warrants/arrests + incorrect warrants/arrests

In other words, given that we think we’ve found drugs, what are the chances that we actually have? It’s the green box in the first column over the total number in the first column. This is the one the base rate can mess with BIG time. You see, when companies that develop tests put them on the market, they can’t know what type of population you’re going to use them on. This value is unknown until you start to use it. A high value here means you’ve minimized false positives.

Negative Predictive Value: The flip side of the positive predictive value, this is about the second column. Given that we got a negative test, what are the chances there are no drugs? This is:

Innocent people who go unbothered
Innocent people who go unbothered + bad guys who get away with it

So for the second column, the number in the  green box over the total second column. A high value here means you’ve minimized false negatives.

So to recap:

Sensitivity and Specificity:

  1. Answer the question “how does the test perform when drug are/are not present”
  2. Refer to the rows (at least in this table set up)
  3. High sensitivity = low false negatives, low sensitivity = lots of false negatives
  4. High specificity = low false positives, low specificity = lots of false positives
  5. Information about how “accurate” one of the values is does not give the whole picture

Positive and Negative Predictive value (PPV and NPV):

  1. Answer the question “Given a positive/negative test result, what are the chances drugs are/are not actually present?”
  2. Refer to columns (at least in this table set up)
  3. High PPV = low false positives, low PPV = high false positives
  4. High NPV = low false negatives, low NPV = high false negatives
  5. Can be heavily influenced by the rate of the underlying condition (in this case drug use) in the population being tested (base rate)


John Napier’s Cockerel

In my post from Sunday, I talked about base rates and how police investigative techniques can go wrong. I specifically focused on testing methods for drug residue, which are not always as accurate as you might hope.

On an interestingly related note, today I was reading the chapter on logarithms from “In Pursuit of the Unknown: 17 Equations That Changed the World” (one of my math books I’m reading this year).  It was discussing John Napier, a Scottish mathematician who invented logarithms in the early 1600s.  Napier was an interesting guy….friend of Tycho Brahe, brilliant mathematician, and possible believer in the occult. For reasons possibly having to do with one of  those last two, he apparently carried a black cockerel (rooster) around with him a lot.

It’s actually not clear if he really was involved in the occult, but he did tell everyone he had a magic rooster. He used it to catch thieves.  Here’s what his strategy was:

JohnNapier

No idea what the base rate was here, or if it would hold up in court today….but maybe something to consider if the budget gets cut.

(Special thanks to the Shakespeare translator for helping me out a bit on this one).

All About that Base Rate

Of all the statistical tricks or treats I like to think about, the base rate (and it’s associated fallacy) are probably the most interesting to me. It’s a common fallacy, in large part because it requires two steps of math to work out what’s going on. I’ve referenced it before, but I wanted a definitive post where I walked through what a base rate is and why you should remember it exists. Ready? Let’s go.

First, let’s find an example.
Like most math problems, this one will be a little easier to follow if we use an example.In my

In my Intro to Internet Science series, I mentioned the troubling case of a couple of former CIA analysts whose house was raided by a SWAT team after they were spotted shopping at the wrong garden store. After spotting the couple purchasing what they thought was marijuana growing equipment, the police had tested their trashcans for the presence of drugs. Twice the police got a positive test result, and thus felt perfectly comfortable raiding the house and holding the parents and kids at gunpoint for two hours while they searched for the major marijuana growing operation they believed they were running. In the end it was determined the couple was actually totally innocent. There’s a lot going on with this story legally, but what was up with those positive drug tests?

Let’s make a contingency table!
In last week’s post, I discussed the fact that there is almost always more than one way to be wrong. A contingency table helps us visualize the various possibilities that can arise from the two different types of test results and the two different realities:

Drugsearch

So here we have four options, two good and two bad:

  1. True positive (yes/yes): we have evidence of actual wrongdoing1
  2. False negative (no/yes): someone with drugs appears innocent
  3. False positive (yes/no): someone without drugs appears guilty
  4. True negative (no/no): an innocent person’s innocence is confirmed

In this case, we ended up with a false positive, but how often does that really happen? Is this just an aberration or something we should be concerned about?

Picking between the lesser of two evils.
Before we go on, let’s take a step back for a minute and consider why the police department may have had to consider when they selected a drug screening test to use. It’s important to recognize that in this situation (as in most of life), you actually do have some discretion over which way you chose to be wrong.  In a perfect world we’d have unlimited resources to buy a test that gets the right answer every time, but in the real world we often have to go the cheap route and consider the consequences of either type of error and make trade-offs.

For example, in medicine false positives are almost always preferable to false negatives. Most doctors (and patients!) would prefer that a screening test told them they might have a disease that they did not have (false positive) than to have a screening test miss a disease they did have (false negative).

In criminal justice, there is a similar preference. Police would rather have evidence of activity that didn’t happen (false positive) then not get evidence when a crime was committed (false negative).

So what kind of trade-offs are we talking about?
Well, in the article I linked to above, it mentioned that one of the downfalls of the drug tests many police departments use is a very high false positive rate…..as high as 70%. This means that if you tested 100 trashcans that were completely free of drugs, you’d get a positive test for 70 of them.

Well that sounds pretty bad….so is that the base rate you were talking about?
No, but it is an important rate to keep in mind because it influences the math in ways that aren’t particularly intuitive for most people. For example, if we test 1000 trash cans, half with drugs and half without, here’s what we get:
Drugsearch2

When the police are out in the field, they get exactly one piece of information: whether or not the trash can tested positive for drugs.  In order to use this information, we actually have to calculate what that means. In the above example, we have 495 true positive trash cans with drugs in them. We also have 350 false positive trash cans with no drugs in them, but with a positive test. So overall, we have 845 trash cans with a positive test. 495/845 is about 59%…..so under these circumstances, a positive test only means drugs are present about 60% of the time.

Now about that base rate……
Okay, so none of that is great, but this actually can get worse. You see, the rate of those who do drugs and those who don’t do drugs isn’t actually equal. The rate of those who don’t do drugs is actually much much higher, and this is the base rate I was talking about before.

According to many reports, about 10% of the US adult population used illegal drugs in the past month (mostly marijuana, FYI….not controlled for states that have legalized it). Presumably this means that about 10% of trash cans might contain drugs at any given time. That makes our numbers look like this:

drugsearch3

Using the same math as above, we get 99/(630+99) = 14%. Now we realize that for every positive test, there’s actually only about a 14% chance there are drugs in that trash can. I’m somewhat curious how much worse that is than just having a trained police officer take a look.  In fact, because the base rates are so different, you actually would need a test with an 11% false positive rate (as compared to the 70% we currently have) to make the chances 50/50 that your test is telling you what you think it’s telling you. Yikes.

Now of course these numbers only holds if you’re testing trash cans randomly….but if you’re testing the garbage of everyone who goes to a garden store on a Saturday morning, that may be a little closer to the truth than you want to admit.

So what’s the takeaway?
The crux of the base rate fallacy is that a small percentage of a large number can easily be larger than a large percentage of a small number. This is basic math, but it becomes hard to remember when you’re in the moment and the information is not being presented in a straightforward way. If you got a math test that said “Which value is larger….11% of 900 or 99% of 100?” You’d probably get it right pretty quickly. However, when it’s up to you to remember what the base rate is, people get much much worse at this problem. In fact, the vast majority of medical doctors don’t get this type of problem correct when it’s presented to them and they’re specifically given the base rate….so my guess is the general population success rate is quite low.

No matter how accurate a test is, if the total number of entries in one of the rows (or columns) is much larger than the total of the other, you should watch out for this.

Base rate matters.
1. Note for the libertarians: It is beyond the scope of this post to discuss current drug policy and whether or not this should actually constitute wrongdoing. Just roll with it.

Three Ways to Be Wrong in Narnia

After my last post on the two different ways of being wrong, the Assistant Village Idiot brought up the dwarves from the book “The Last Battle” from the Chronicles of Narnia series. I was curious what the contingency matrix for that book would look like. I haven’t read it in a while, but I quickly realized there were actually three pretty distinct ways of being wrong in that book. As far as I can tell, the matrix looks like this:

2by2narnia

You’re welcome.

Two Ways To Be Wrong

One of the most interesting things I’ve gotten to do since I started blogging about data/stats/science is to go to high school classrooms and share some of what I’ve learned. I started with my brother’s Environmental Science class a few years ago, and that has expanded to include other classes at his school and some other classes elsewhere. I often get more out of these talks than the kids do…something about the questions and immediate feedback really pushes me to think about how I present things.

Given that, I was intrigued by a call I got from my brother yesterday. We were talking a bit about science and skepticism, and he mentioned that as the year wound down he was having to walk back on some of what I presented to his class at the beginning of the year. The problem, he said, was not that the kids had failed to grasp the message of skepticism…but rather that they had grasped it too well. He had spent the year attempting to get kids to think critically, and was now hearing his kids essentially claim it was impossible to know anything because everything could be manipulated.

Oops.

I was thinking about this after we hung up, and how important it is not to leave the impression that there’s only one way to be wrong.  In most situations that need a judgment call, there’s actually two ways to be wrong.  Stats and medicine have a really interesting tool for showing this phenomena: a 2×2 contingency matrix . Basically, you take two different conditions and sort how often they agree or disagree and under what circumstances those happen.

For example, for my brother’s class, this is the contingency matrix:

Skepticalgullible

In terms of outcomes,  we have 4 options:

  1. True Positive:  Believing a true idea (brilliant early adopter).
  2. False Negative (Type II error): Not believing a true idea (in denial/impeding progress).
  3. False Positive (Type I error): Believing a false idea (gullible rube)
  4. True Negative: Not believing a false idea (appropriately skeptical)

Of those four options, #2 and #3 are the two we want to avoid. In those cases the reality (true or not) clashes with the test (in this case our assessment of the truth).  In my talk and my brother’s later lessons, we focused on eliminating #3. One way of doing this is to be more discerning with what we believe or we don’t, but many people can leave with the impression that disbelieving everything is the way to go. While that will absolutely reduce the number of false positive beliefs, it will also increase the number of false negatives. Now, depending on the field this may not be a bad thing, but overall it’s just substituting one lack of thought for another. What’s trickier is to stay open to evidence while also being skeptical.

It’s probably worth mentioning that not everyone gets into these categories honestly…some people believe a true thing pretty much by accident or fail to believe a false thing for bad reasons. Every field has an example of someone who accidentally ended up on the right side of history. There also aren’t always just two possibilities, many scientific theories have shades of gray.

Caveats aside, it’s important to at least raise the possibility that not all errors are the same. Most of us have a bias towards one error or another, and will exhort others to avoid one at the expense of the other. However, for both our own sense of humility and the full education of others, it’s probably worth keeping an eye on the other way of being wrong.

Lost in Translation: Survey Edition

I ran across an interesting article from Quartz today that serves as an interesting warning for those attempting to compare cross-cultural survey results.

People from multiple countries were asked the same question “Would you personally accept a refugee into your own home?”, and the results were compared to find the “most welcoming” country.  China came out ahead by a large margin: 46% of residents said yes, as compared to 15% of US residents.

However, when the question was more closely examined, it was discovered that the English word “refugee” does not have an exact translation in Chinese. While in the US “refugee” almost always refers to someone from another country, in Chinese the word has a more neutral “person who has experienced a calamity” definition. Depending on the situation, it is then modified with either “domestic” or “international”.  The survey question did not contain either modifier, so it was up to the respondent’s personal interpretation.

So basically, people in different countries were answering different questions and then the results were compared. Surveys are already prone to lots of bias, and adding inexact translations into the mix can obviously heighten that effect. Interesting thing to be aware of when reading any research that compares international responses.

5 Things You Should Know About Medical Errors and Mortality

Medical Errors are No. 3 Cause of US Deaths“.  As someone who has spent her entire career working in hospitals, I was interested to see this headline a few weeks ago. I was intrigued by the data, but a little skeptical. Not only have I seen a lot of patient deaths, but it seems relatively rare in my day-to-day life that I see someone reference a death by medical error.  However, according to Makary et al in the BMJ this month, it happens over 250,000 times a year.

Since the report came out, two of my favorite websites (Science Based Medicine and Health News Review ) have come out with some critiques of the study. The pieces are both excellent and long, so I thought I’d go over some highlights:

  1. This study is actually a review, combined with some mathematical modeling. Though reported as a study in the press, this was actually an extrapolation based off of 4 earlier studies from 1999, 2002, 2004 and 2010. I don’t have access to the full paper, but according to the Skeptical Scalpel, the underlying papers found 35 preventable deaths. It’s that number that got extrapolated out to 250,000.
  2. No one needs to have made an error for something to be called an error. When you hear the word “error” you typically think of someone needing to do “x” but instead doing “y” or doing nothing at all. All 4 studies used in the Makary analysis had a different definition of “error”, and it wasn’t always that straightforward and required a lot of judgment calls to classify. Errors were essentially defined as “preventable adverse events”, even in cases where no one could say how you would have prevented it. For example, in one study serious post-surgical hemorrhaging was  always considered an error, even when there was no error identified. Essentially some conditions were assumed to ALWAYS be caused by an error, even if they were a known risk of the procedure. That definition wasn’t even the most liberal one used by the way….at least one of the studies called ALL “adverse events” during care preventable. That’s pretty broad.
  3. Some of the samples were skewed. The largest paper included actually looked exclusively at Medicare recipients (aka those over 65), and at least according to the Science Based Medicine review, it doesn’t seem they controlled for the age issue when extrapolating for the country as a whole. The numbers ultimately suggest that 1/3 of all deaths occurring in a hospital are due to error…..which seems a bit high.
  4. Prior health status isn’t known or reported. One of the primary complaints of the authors of the study is that “medical error” isn’t counted in official cause of death statistics, only the underlying condition. This means that someone seeking treatment for cancer they weren’t otherwise going to die from who dies of a medical error gets counted as a cancer death. On the other hand, this means that someone who was about to die of cancer but also has a medical error gets counted as a cancer death. Since sick people receive far more treatment, we do know most of these errors are happening to already sick people. Really the ideal metric here would be “years of life lost” to help control for people who were severely ill prior to the error.
  5. Over-reporting of medical errors isn’t entirely benign. A significant amount of my job is focused on improving the quality of what we do. I am always grateful when people point out that errors happen in medicine, and draw attention to the problem. On the other hand, there is some concern that stories like this could leave your average person with the impression that avoiding hospitals is safer than actually seeking care. This isn’t true. One of the reasons we have so many medical errors in this country is because medicine can actually do a lot for you. It’s not perfect by any means, but the more options we have and the longer we keep people alive using medicine, the more likely it is that someone administering that care is going to screw up. In many cases, delaying or avoiding care will kill you a heck of a lot faster even the most egregiously sloppy health care provider.

Again, none of this is to say that errors aren’t a big deal. No matter how you define them, we should always be working to reduce them. However, as with all data, it’s good to know exactly what we’re looking at here.

Statistical Tricks and Treats

Well hi!

After 8 fantastic weeks of working with Ben on the good, the bad, and the ugly of Pop Science, it’s time to move on to a new Sunday series.

When I give my talk to high school students, one of my biggest struggles is really not having time to cover any math. That’s  what I really love, but it’s pretty much impossible in a short time frame and when I’ve tried I always feel like I do kids a disservice. I mentioned some of this struggle in Part 7 of my Internet Science series, and I realized I probably have enough to say about this that I can make a whole series about it.

A few likely posts you’ll be seeing:

  1. That sneaky average
  2. Base rates and other shenanigans
  3. Independence and Probability
  4. To replicate or not to replicate
  5. Correlation and causation

If you’d like to see anything else, let me know!